Scotch-Irish vs Immigrants from Ukraine Self-Care Disability
COMPARE
Scotch-Irish
Immigrants from Ukraine
Self-Care Disability
Self-Care Disability Comparison
Scotch-Irish
Immigrants from Ukraine
2.6%
SELF-CARE DISABILITY
4.1/ 100
METRIC RATING
218th/ 347
METRIC RANK
2.7%
SELF-CARE DISABILITY
0.1/ 100
METRIC RATING
277th/ 347
METRIC RANK
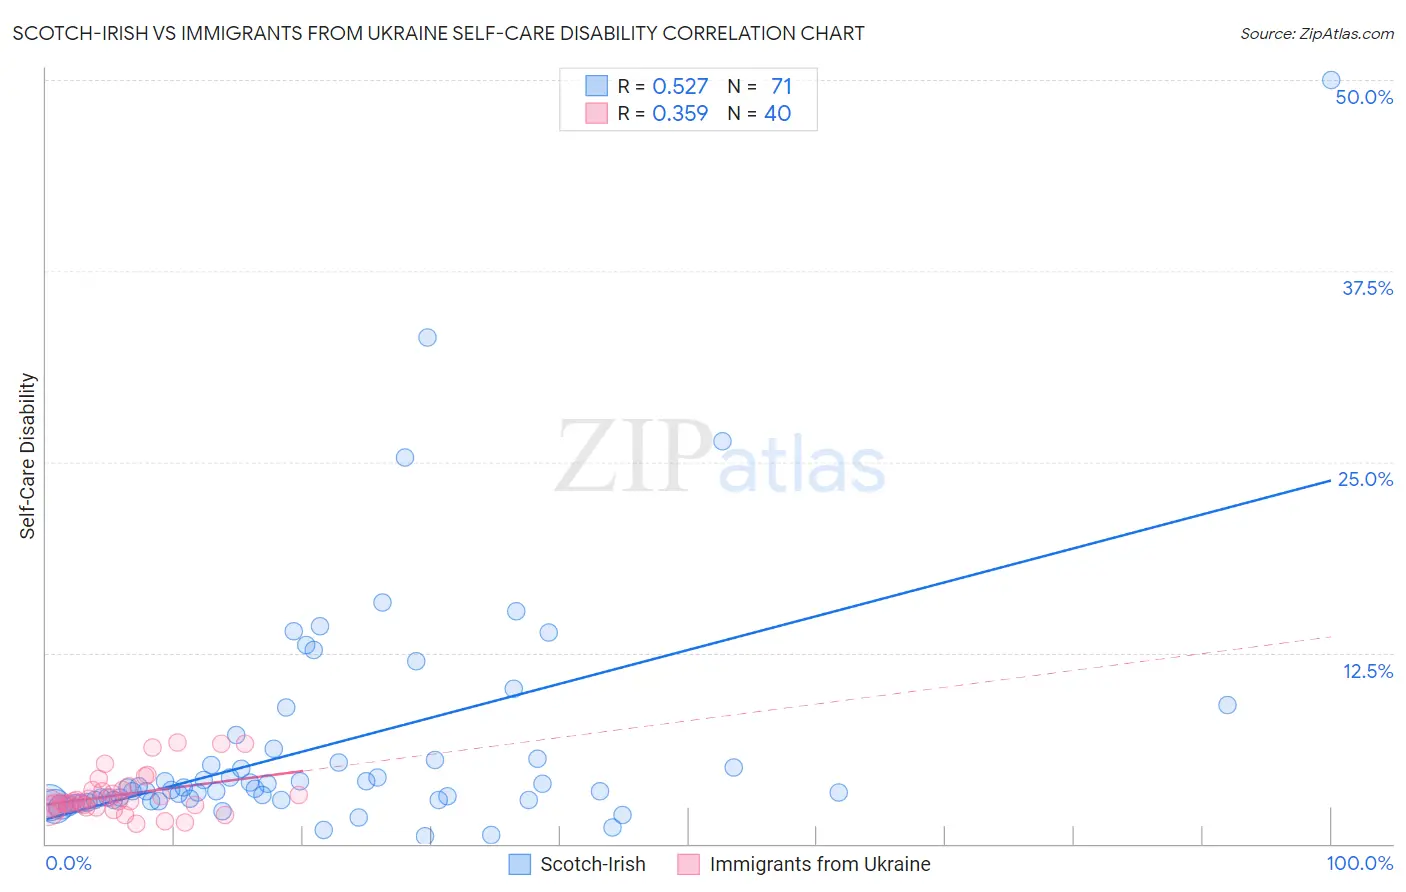
Scotch-Irish vs Immigrants from Ukraine Self-Care Disability Correlation Chart
The statistical analysis conducted on geographies consisting of 547,085,910 people shows a substantial positive correlation between the proportion of Scotch-Irish and percentage of population with self-care disability in the United States with a correlation coefficient (R) of 0.527 and weighted average of 2.6%. Similarly, the statistical analysis conducted on geographies consisting of 289,474,241 people shows a mild positive correlation between the proportion of Immigrants from Ukraine and percentage of population with self-care disability in the United States with a correlation coefficient (R) of 0.359 and weighted average of 2.7%, a difference of 4.9%.
Self-Care Disability Correlation Summary
| Measurement | Scotch-Irish | Immigrants from Ukraine |
| Minimum | 0.47% | 1.3% |
| Maximum | 50.0% | 6.6% |
| Range | 49.5% | 5.3% |
| Mean | 6.5% | 3.2% |
| Median | 3.6% | 2.8% |
| Interquartile 25% (IQ1) | 2.8% | 2.4% |
| Interquartile 75% (IQ3) | 5.6% | 3.5% |
| Interquartile Range (IQR) | 2.7% | 1.1% |
| Standard Deviation (Sample) | 8.0% | 1.4% |
| Standard Deviation (Population) | 7.9% | 1.4% |
Similar Demographics by Self-Care Disability
Demographics Similar to Scotch-Irish by Self-Care Disability
In terms of self-care disability, the demographic groups most similar to Scotch-Irish are Immigrants from Moldova (2.6%, a difference of 0.030%), Subsaharan African (2.6%, a difference of 0.040%), Celtic (2.6%, a difference of 0.070%), Honduran (2.6%, a difference of 0.080%), and White/Caucasian (2.6%, a difference of 0.090%).
| Demographics | Rating | Rank | Self-Care Disability |
| Native Hawaiians | 5.1 /100 | #211 | Tragic 2.6% |
| Samoans | 5.1 /100 | #212 | Tragic 2.6% |
| Ecuadorians | 4.7 /100 | #213 | Tragic 2.6% |
| Immigrants | Honduras | 4.7 /100 | #214 | Tragic 2.6% |
| Immigrants | Thailand | 4.5 /100 | #215 | Tragic 2.6% |
| Whites/Caucasians | 4.4 /100 | #216 | Tragic 2.6% |
| Celtics | 4.4 /100 | #217 | Tragic 2.6% |
| Scotch-Irish | 4.1 /100 | #218 | Tragic 2.6% |
| Immigrants | Moldova | 4.0 /100 | #219 | Tragic 2.6% |
| Sub-Saharan Africans | 4.0 /100 | #220 | Tragic 2.6% |
| Hondurans | 3.8 /100 | #221 | Tragic 2.6% |
| Spaniards | 3.8 /100 | #222 | Tragic 2.6% |
| French Canadians | 3.8 /100 | #223 | Tragic 2.6% |
| Osage | 3.6 /100 | #224 | Tragic 2.6% |
| Iraqis | 3.2 /100 | #225 | Tragic 2.6% |
Demographics Similar to Immigrants from Ukraine by Self-Care Disability
In terms of self-care disability, the demographic groups most similar to Immigrants from Ukraine are Japanese (2.7%, a difference of 0.060%), Ottawa (2.7%, a difference of 0.080%), Iroquois (2.7%, a difference of 0.18%), Yakama (2.7%, a difference of 0.19%), and Immigrants from Trinidad and Tobago (2.7%, a difference of 0.19%).
| Demographics | Rating | Rank | Self-Care Disability |
| Immigrants | Micronesia | 0.1 /100 | #270 | Tragic 2.7% |
| Trinidadians and Tobagonians | 0.1 /100 | #271 | Tragic 2.7% |
| Immigrants | Laos | 0.1 /100 | #272 | Tragic 2.7% |
| Mexicans | 0.1 /100 | #273 | Tragic 2.7% |
| Yakama | 0.1 /100 | #274 | Tragic 2.7% |
| Immigrants | Trinidad and Tobago | 0.1 /100 | #275 | Tragic 2.7% |
| Japanese | 0.1 /100 | #276 | Tragic 2.7% |
| Immigrants | Ukraine | 0.1 /100 | #277 | Tragic 2.7% |
| Ottawa | 0.1 /100 | #278 | Tragic 2.7% |
| Iroquois | 0.1 /100 | #279 | Tragic 2.7% |
| Hispanics or Latinos | 0.1 /100 | #280 | Tragic 2.7% |
| Immigrants | Iraq | 0.0 /100 | #281 | Tragic 2.7% |
| Apache | 0.0 /100 | #282 | Tragic 2.7% |
| Delaware | 0.0 /100 | #283 | Tragic 2.7% |
| Fijians | 0.0 /100 | #284 | Tragic 2.7% |