Immigrants from Colombia vs Immigrants from Ukraine Disability Age Over 75
COMPARE
Immigrants from Colombia
Immigrants from Ukraine
Disability Age Over 75
Disability Age Over 75 Comparison
Immigrants from Colombia
Immigrants from Ukraine
46.7%
DISABILITY AGE OVER 75
92.6/ 100
METRIC RATING
123rd/ 347
METRIC RANK
47.7%
DISABILITY AGE OVER 75
23.2/ 100
METRIC RATING
198th/ 347
METRIC RANK
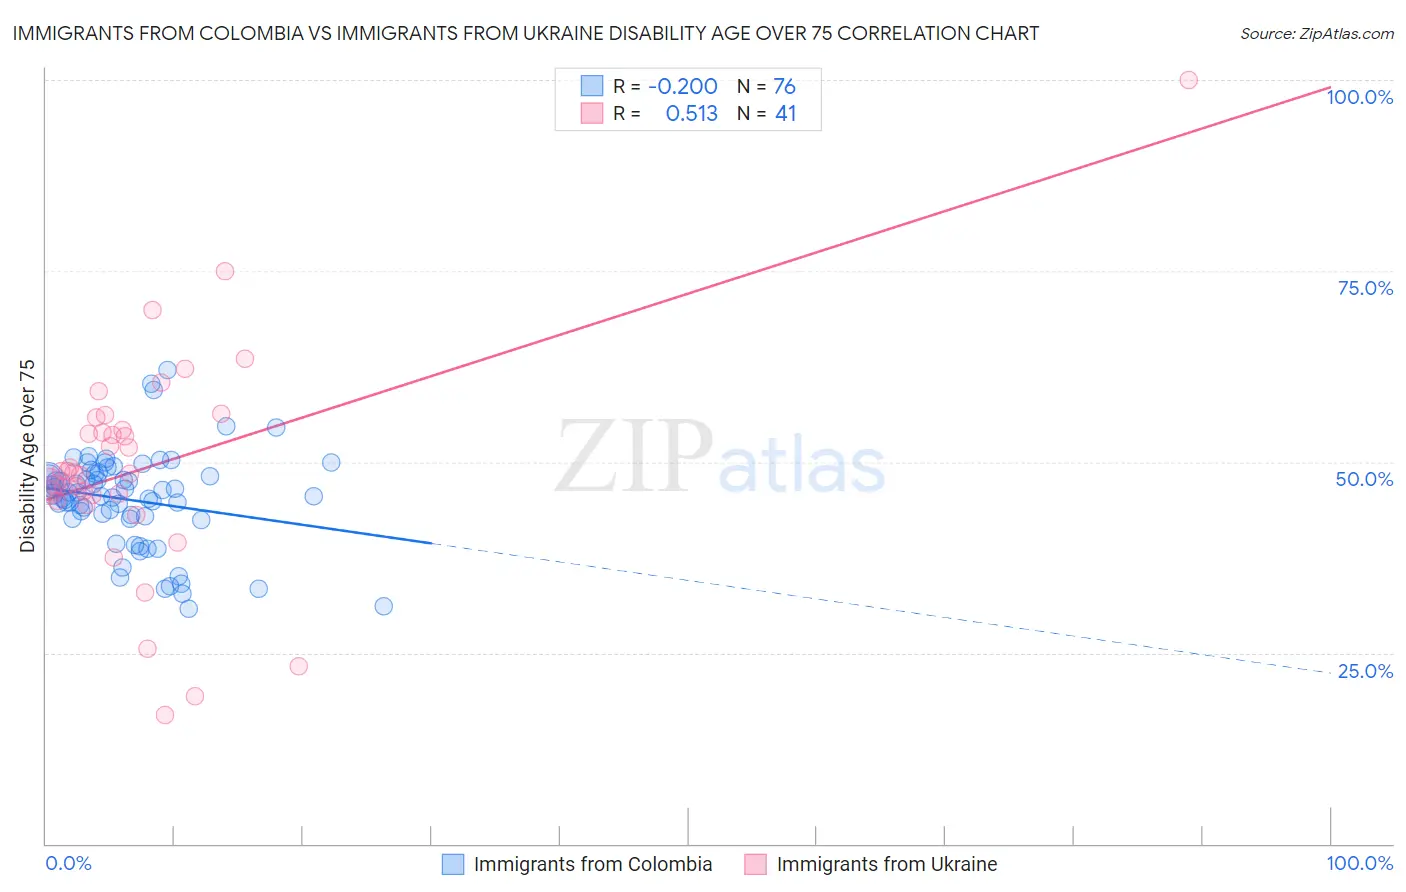
Immigrants from Colombia vs Immigrants from Ukraine Disability Age Over 75 Correlation Chart
The statistical analysis conducted on geographies consisting of 378,064,071 people shows a poor negative correlation between the proportion of Immigrants from Colombia and percentage of population with a disability over the age of 75 in the United States with a correlation coefficient (R) of -0.200 and weighted average of 46.7%. Similarly, the statistical analysis conducted on geographies consisting of 289,393,275 people shows a substantial positive correlation between the proportion of Immigrants from Ukraine and percentage of population with a disability over the age of 75 in the United States with a correlation coefficient (R) of 0.513 and weighted average of 47.7%, a difference of 2.1%.
Disability Age Over 75 Correlation Summary
| Measurement | Immigrants from Colombia | Immigrants from Ukraine |
| Minimum | 30.8% | 16.9% |
| Maximum | 62.0% | 100.0% |
| Range | 31.2% | 83.1% |
| Mean | 45.0% | 49.3% |
| Median | 45.6% | 48.7% |
| Interquartile 25% (IQ1) | 42.8% | 45.2% |
| Interquartile 75% (IQ3) | 48.3% | 55.0% |
| Interquartile Range (IQR) | 5.5% | 9.8% |
| Standard Deviation (Sample) | 6.2% | 14.4% |
| Standard Deviation (Population) | 6.2% | 14.3% |
Similar Demographics by Disability Age Over 75
Demographics Similar to Immigrants from Colombia by Disability Age Over 75
In terms of disability age over 75, the demographic groups most similar to Immigrants from Colombia are Immigrants from Albania (46.6%, a difference of 0.050%), Immigrants from South America (46.7%, a difference of 0.060%), Colombian (46.7%, a difference of 0.090%), Scandinavian (46.6%, a difference of 0.10%), and European (46.7%, a difference of 0.10%).
| Demographics | Rating | Rank | Disability Age Over 75 |
| Indians (Asian) | 95.7 /100 | #116 | Exceptional 46.5% |
| Hungarians | 95.3 /100 | #117 | Exceptional 46.5% |
| Czechoslovakians | 94.7 /100 | #118 | Exceptional 46.6% |
| Canadians | 94.4 /100 | #119 | Exceptional 46.6% |
| Immigrants | Nepal | 94.1 /100 | #120 | Exceptional 46.6% |
| Scandinavians | 93.6 /100 | #121 | Exceptional 46.6% |
| Immigrants | Albania | 93.2 /100 | #122 | Exceptional 46.6% |
| Immigrants | Colombia | 92.6 /100 | #123 | Exceptional 46.7% |
| Immigrants | South America | 91.8 /100 | #124 | Exceptional 46.7% |
| Colombians | 91.3 /100 | #125 | Exceptional 46.7% |
| Europeans | 91.2 /100 | #126 | Exceptional 46.7% |
| Syrians | 91.1 /100 | #127 | Exceptional 46.7% |
| Icelanders | 90.9 /100 | #128 | Exceptional 46.7% |
| Immigrants | Germany | 90.8 /100 | #129 | Exceptional 46.7% |
| Immigrants | Northern Africa | 90.7 /100 | #130 | Exceptional 46.7% |
Demographics Similar to Immigrants from Ukraine by Disability Age Over 75
In terms of disability age over 75, the demographic groups most similar to Immigrants from Ukraine are Pakistani (47.7%, a difference of 0.010%), Immigrants from Portugal (47.6%, a difference of 0.020%), Immigrants from Eritrea (47.7%, a difference of 0.020%), Immigrants from Trinidad and Tobago (47.6%, a difference of 0.060%), and Immigrants from Somalia (47.7%, a difference of 0.060%).
| Demographics | Rating | Rank | Disability Age Over 75 |
| Portuguese | 29.3 /100 | #191 | Fair 47.6% |
| Immigrants | Jamaica | 28.3 /100 | #192 | Fair 47.6% |
| Ottawa | 28.1 /100 | #193 | Fair 47.6% |
| Immigrants | Lebanon | 26.5 /100 | #194 | Fair 47.6% |
| Immigrants | Trinidad and Tobago | 25.3 /100 | #195 | Fair 47.6% |
| Immigrants | Portugal | 23.8 /100 | #196 | Fair 47.6% |
| Pakistanis | 23.4 /100 | #197 | Fair 47.7% |
| Immigrants | Ukraine | 23.2 /100 | #198 | Fair 47.7% |
| Immigrants | Eritrea | 22.4 /100 | #199 | Fair 47.7% |
| Immigrants | Somalia | 21.4 /100 | #200 | Fair 47.7% |
| Immigrants | Cuba | 20.9 /100 | #201 | Fair 47.7% |
| Immigrants | Bahamas | 20.7 /100 | #202 | Fair 47.7% |
| Trinidadians and Tobagonians | 20.0 /100 | #203 | Fair 47.7% |
| Nigerians | 19.2 /100 | #204 | Poor 47.7% |
| Immigrants | Ghana | 19.1 /100 | #205 | Poor 47.7% |