Spanish American vs Immigrants from Oceania Disability Age Over 75
COMPARE
Spanish American
Immigrants from Oceania
Disability Age Over 75
Disability Age Over 75 Comparison
Spanish Americans
Immigrants from Oceania
50.0%
DISABILITY AGE OVER 75
0.0/ 100
METRIC RATING
295th/ 347
METRIC RANK
48.0%
DISABILITY AGE OVER 75
7.3/ 100
METRIC RATING
221st/ 347
METRIC RANK
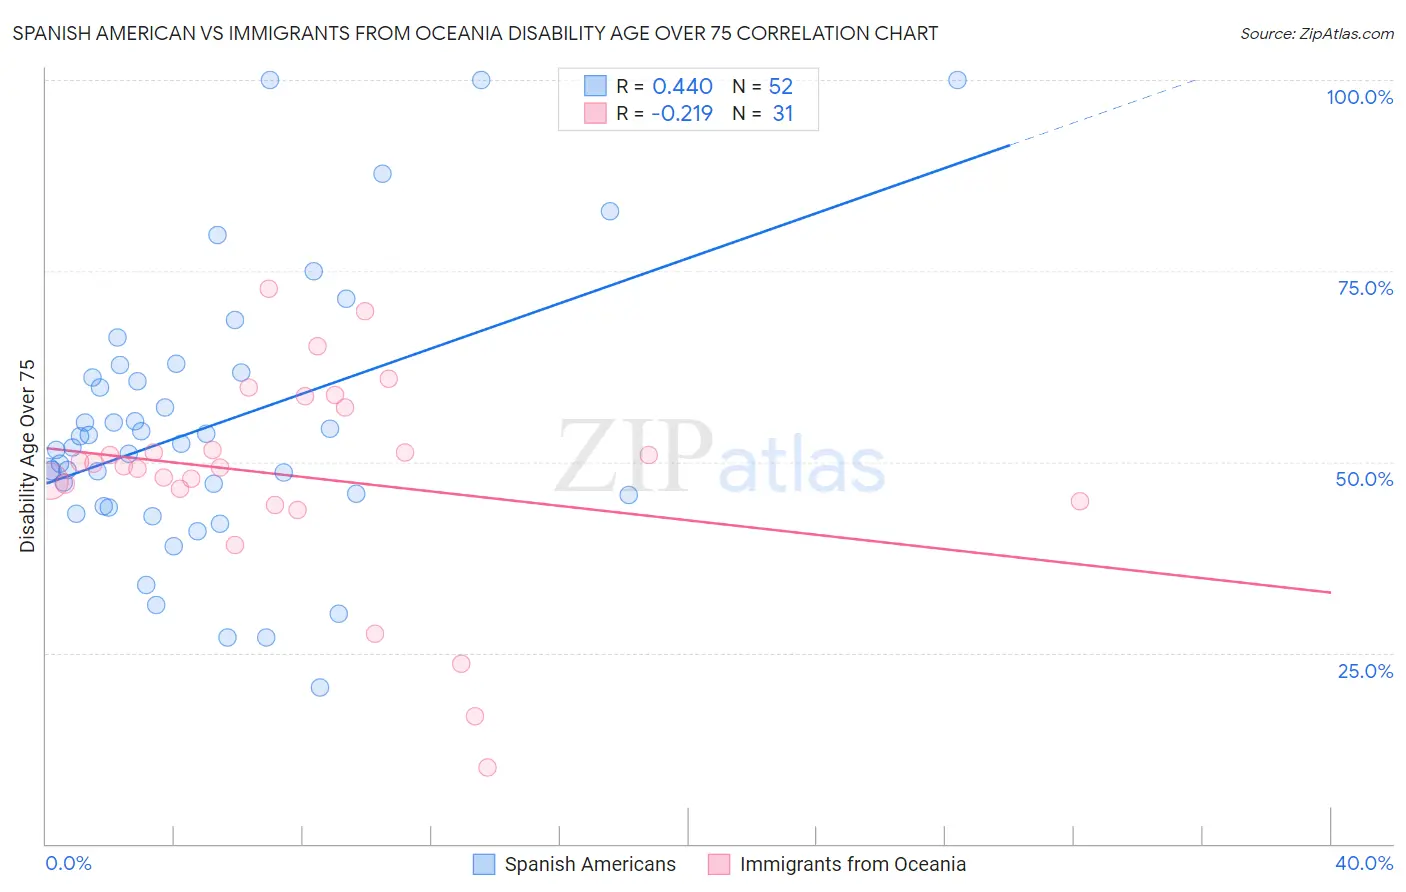
Spanish American vs Immigrants from Oceania Disability Age Over 75 Correlation Chart
The statistical analysis conducted on geographies consisting of 103,158,462 people shows a moderate positive correlation between the proportion of Spanish Americans and percentage of population with a disability over the age of 75 in the United States with a correlation coefficient (R) of 0.440 and weighted average of 50.0%. Similarly, the statistical analysis conducted on geographies consisting of 304,867,305 people shows a weak negative correlation between the proportion of Immigrants from Oceania and percentage of population with a disability over the age of 75 in the United States with a correlation coefficient (R) of -0.219 and weighted average of 48.0%, a difference of 4.2%.
Disability Age Over 75 Correlation Summary
| Measurement | Spanish American | Immigrants from Oceania |
| Minimum | 20.5% | 10.0% |
| Maximum | 100.0% | 72.7% |
| Range | 79.5% | 62.7% |
| Mean | 54.7% | 48.2% |
| Median | 52.1% | 49.5% |
| Interquartile 25% (IQ1) | 44.9% | 44.8% |
| Interquartile 75% (IQ3) | 61.4% | 57.1% |
| Interquartile Range (IQR) | 16.4% | 12.3% |
| Standard Deviation (Sample) | 17.6% | 13.7% |
| Standard Deviation (Population) | 17.5% | 13.5% |
Similar Demographics by Disability Age Over 75
Demographics Similar to Spanish Americans by Disability Age Over 75
In terms of disability age over 75, the demographic groups most similar to Spanish Americans are Immigrants from Cambodia (50.0%, a difference of 0.040%), Mexican American Indian (50.0%, a difference of 0.040%), Armenian (50.0%, a difference of 0.060%), Marshallese (50.1%, a difference of 0.12%), and Spanish American Indian (49.9%, a difference of 0.16%).
| Demographics | Rating | Rank | Disability Age Over 75 |
| Yaqui | 0.0 /100 | #288 | Tragic 49.8% |
| Osage | 0.0 /100 | #289 | Tragic 49.8% |
| Puget Sound Salish | 0.0 /100 | #290 | Tragic 49.8% |
| Arapaho | 0.0 /100 | #291 | Tragic 49.8% |
| Shoshone | 0.0 /100 | #292 | Tragic 49.9% |
| Spanish American Indians | 0.0 /100 | #293 | Tragic 49.9% |
| Immigrants | Cambodia | 0.0 /100 | #294 | Tragic 50.0% |
| Spanish Americans | 0.0 /100 | #295 | Tragic 50.0% |
| Mexican American Indians | 0.0 /100 | #296 | Tragic 50.0% |
| Armenians | 0.0 /100 | #297 | Tragic 50.0% |
| Marshallese | 0.0 /100 | #298 | Tragic 50.1% |
| Immigrants | Micronesia | 0.0 /100 | #299 | Tragic 50.1% |
| Cape Verdeans | 0.0 /100 | #300 | Tragic 50.1% |
| Dominicans | 0.0 /100 | #301 | Tragic 50.2% |
| Cherokee | 0.0 /100 | #302 | Tragic 50.2% |
Demographics Similar to Immigrants from Oceania by Disability Age Over 75
In terms of disability age over 75, the demographic groups most similar to Immigrants from Oceania are Immigrants from Western Asia (48.0%, a difference of 0.010%), Bahamian (48.0%, a difference of 0.010%), Barbadian (48.0%, a difference of 0.040%), Immigrants from Bangladesh (48.0%, a difference of 0.050%), and Liberian (48.0%, a difference of 0.060%).
| Demographics | Rating | Rank | Disability Age Over 75 |
| Immigrants | Barbados | 10.7 /100 | #214 | Poor 47.9% |
| Senegalese | 10.7 /100 | #215 | Poor 47.9% |
| Immigrants | Panama | 10.2 /100 | #216 | Poor 47.9% |
| Immigrants | Grenada | 9.4 /100 | #217 | Tragic 47.9% |
| Immigrants | Western Africa | 8.3 /100 | #218 | Tragic 48.0% |
| Immigrants | Western Asia | 7.5 /100 | #219 | Tragic 48.0% |
| Bahamians | 7.4 /100 | #220 | Tragic 48.0% |
| Immigrants | Oceania | 7.3 /100 | #221 | Tragic 48.0% |
| Barbadians | 6.8 /100 | #222 | Tragic 48.0% |
| Immigrants | Bangladesh | 6.8 /100 | #223 | Tragic 48.0% |
| Liberians | 6.7 /100 | #224 | Tragic 48.0% |
| Spanish | 6.5 /100 | #225 | Tragic 48.0% |
| Immigrants | Nonimmigrants | 6.5 /100 | #226 | Tragic 48.0% |
| Zimbabweans | 6.4 /100 | #227 | Tragic 48.1% |
| Immigrants | Liberia | 5.9 /100 | #228 | Tragic 48.1% |