Afghan vs Immigrants from Oceania Disability Age Over 75
COMPARE
Afghan
Immigrants from Oceania
Disability Age Over 75
Disability Age Over 75 Comparison
Afghans
Immigrants from Oceania
48.4%
DISABILITY AGE OVER 75
1.8/ 100
METRIC RATING
244th/ 347
METRIC RANK
48.0%
DISABILITY AGE OVER 75
7.3/ 100
METRIC RATING
221st/ 347
METRIC RANK
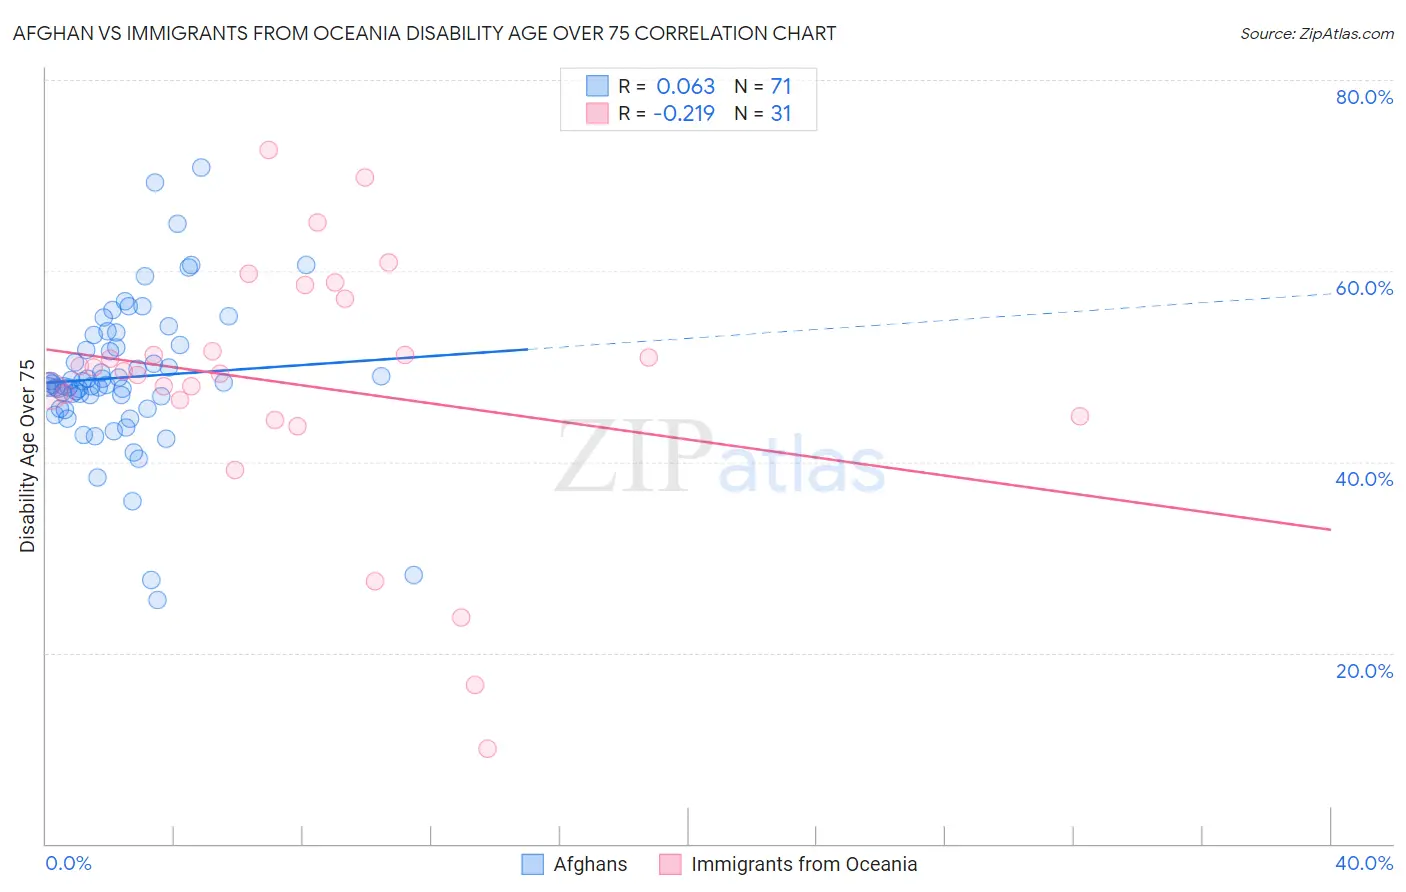
Afghan vs Immigrants from Oceania Disability Age Over 75 Correlation Chart
The statistical analysis conducted on geographies consisting of 148,746,614 people shows a slight positive correlation between the proportion of Afghans and percentage of population with a disability over the age of 75 in the United States with a correlation coefficient (R) of 0.063 and weighted average of 48.4%. Similarly, the statistical analysis conducted on geographies consisting of 304,867,305 people shows a weak negative correlation between the proportion of Immigrants from Oceania and percentage of population with a disability over the age of 75 in the United States with a correlation coefficient (R) of -0.219 and weighted average of 48.0%, a difference of 0.81%.
Disability Age Over 75 Correlation Summary
| Measurement | Afghan | Immigrants from Oceania |
| Minimum | 25.5% | 10.0% |
| Maximum | 70.8% | 72.7% |
| Range | 45.3% | 62.7% |
| Mean | 48.9% | 48.2% |
| Median | 48.1% | 49.5% |
| Interquartile 25% (IQ1) | 45.6% | 44.8% |
| Interquartile 75% (IQ3) | 52.3% | 57.1% |
| Interquartile Range (IQR) | 6.6% | 12.3% |
| Standard Deviation (Sample) | 7.8% | 13.7% |
| Standard Deviation (Population) | 7.7% | 13.5% |
Similar Demographics by Disability Age Over 75
Demographics Similar to Afghans by Disability Age Over 75
In terms of disability age over 75, the demographic groups most similar to Afghans are American (48.4%, a difference of 0.020%), Chippewa (48.4%, a difference of 0.060%), Iroquois (48.4%, a difference of 0.070%), Immigrants from Caribbean (48.4%, a difference of 0.090%), and Native Hawaiian (48.3%, a difference of 0.13%).
| Demographics | Rating | Rank | Disability Age Over 75 |
| Immigrants | St. Vincent and the Grenadines | 3.2 /100 | #237 | Tragic 48.2% |
| Nicaraguans | 3.0 /100 | #238 | Tragic 48.3% |
| Immigrants | Thailand | 2.8 /100 | #239 | Tragic 48.3% |
| Tongans | 2.3 /100 | #240 | Tragic 48.3% |
| Native Hawaiians | 2.2 /100 | #241 | Tragic 48.3% |
| French American Indians | 2.2 /100 | #242 | Tragic 48.3% |
| Immigrants | Caribbean | 2.1 /100 | #243 | Tragic 48.4% |
| Afghans | 1.8 /100 | #244 | Tragic 48.4% |
| Americans | 1.7 /100 | #245 | Tragic 48.4% |
| Chippewa | 1.6 /100 | #246 | Tragic 48.4% |
| Iroquois | 1.6 /100 | #247 | Tragic 48.4% |
| Sri Lankans | 1.4 /100 | #248 | Tragic 48.5% |
| Iraqis | 1.0 /100 | #249 | Tragic 48.6% |
| West Indians | 0.8 /100 | #250 | Tragic 48.6% |
| Koreans | 0.8 /100 | #251 | Tragic 48.6% |
Demographics Similar to Immigrants from Oceania by Disability Age Over 75
In terms of disability age over 75, the demographic groups most similar to Immigrants from Oceania are Immigrants from Western Asia (48.0%, a difference of 0.010%), Bahamian (48.0%, a difference of 0.010%), Barbadian (48.0%, a difference of 0.040%), Immigrants from Bangladesh (48.0%, a difference of 0.050%), and Liberian (48.0%, a difference of 0.060%).
| Demographics | Rating | Rank | Disability Age Over 75 |
| Immigrants | Barbados | 10.7 /100 | #214 | Poor 47.9% |
| Senegalese | 10.7 /100 | #215 | Poor 47.9% |
| Immigrants | Panama | 10.2 /100 | #216 | Poor 47.9% |
| Immigrants | Grenada | 9.4 /100 | #217 | Tragic 47.9% |
| Immigrants | Western Africa | 8.3 /100 | #218 | Tragic 48.0% |
| Immigrants | Western Asia | 7.5 /100 | #219 | Tragic 48.0% |
| Bahamians | 7.4 /100 | #220 | Tragic 48.0% |
| Immigrants | Oceania | 7.3 /100 | #221 | Tragic 48.0% |
| Barbadians | 6.8 /100 | #222 | Tragic 48.0% |
| Immigrants | Bangladesh | 6.8 /100 | #223 | Tragic 48.0% |
| Liberians | 6.7 /100 | #224 | Tragic 48.0% |
| Spanish | 6.5 /100 | #225 | Tragic 48.0% |
| Immigrants | Nonimmigrants | 6.5 /100 | #226 | Tragic 48.0% |
| Zimbabweans | 6.4 /100 | #227 | Tragic 48.1% |
| Immigrants | Liberia | 5.9 /100 | #228 | Tragic 48.1% |