Immigrants from Bolivia vs Guatemalan Disability Age Over 75
COMPARE
Immigrants from Bolivia
Guatemalan
Disability Age Over 75
Disability Age Over 75 Comparison
Immigrants from Bolivia
Guatemalans
45.4%
DISABILITY AGE OVER 75
99.9/ 100
METRIC RATING
25th/ 347
METRIC RANK
49.0%
DISABILITY AGE OVER 75
0.2/ 100
METRIC RATING
268th/ 347
METRIC RANK
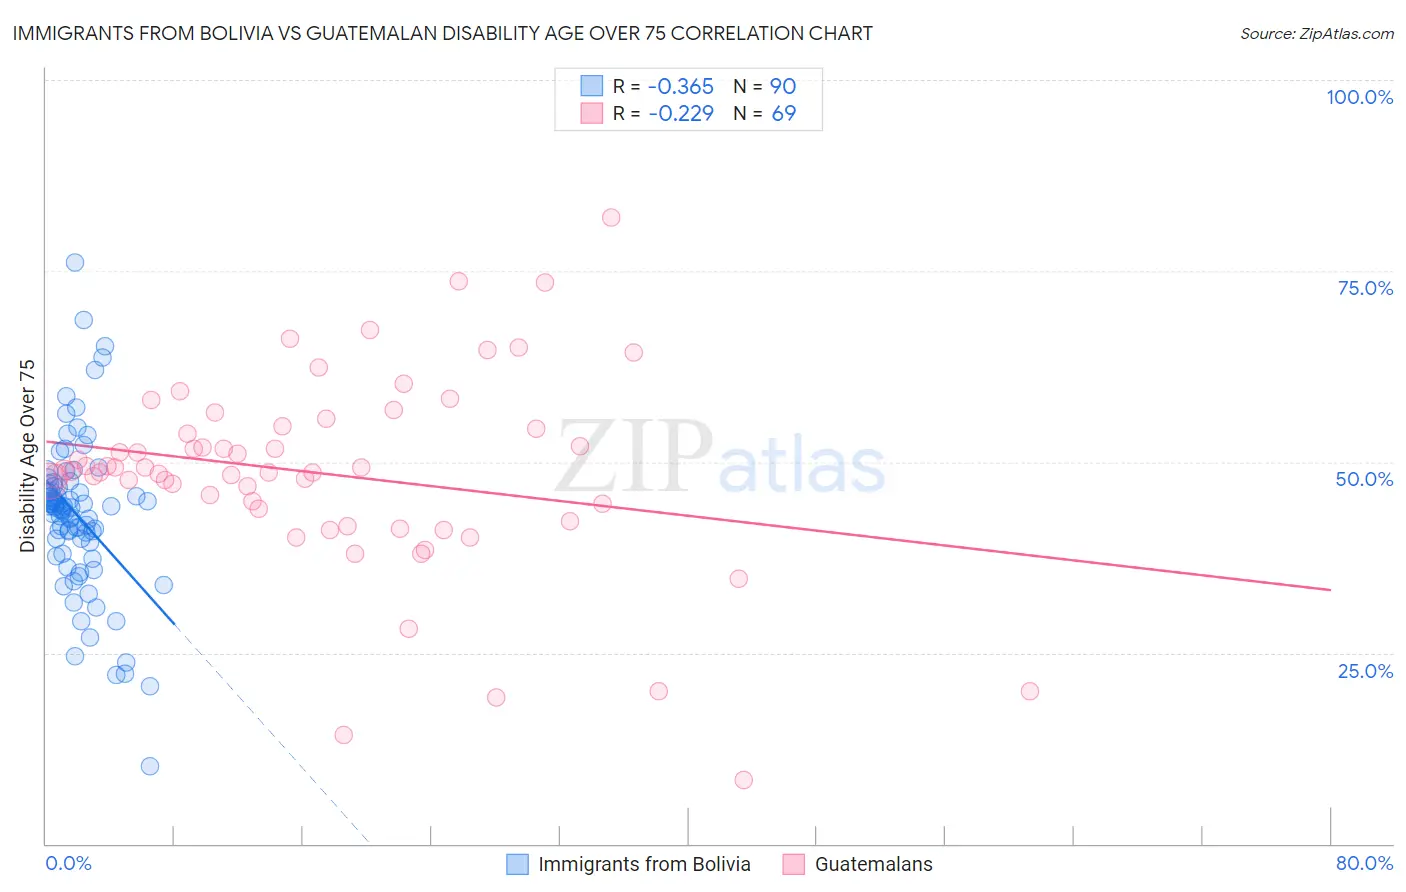
Immigrants from Bolivia vs Guatemalan Disability Age Over 75 Correlation Chart
The statistical analysis conducted on geographies consisting of 158,656,744 people shows a mild negative correlation between the proportion of Immigrants from Bolivia and percentage of population with a disability over the age of 75 in the United States with a correlation coefficient (R) of -0.365 and weighted average of 45.4%. Similarly, the statistical analysis conducted on geographies consisting of 408,753,753 people shows a weak negative correlation between the proportion of Guatemalans and percentage of population with a disability over the age of 75 in the United States with a correlation coefficient (R) of -0.229 and weighted average of 49.0%, a difference of 8.0%.
Disability Age Over 75 Correlation Summary
| Measurement | Immigrants from Bolivia | Guatemalan |
| Minimum | 10.2% | 8.3% |
| Maximum | 76.1% | 82.1% |
| Range | 65.9% | 73.7% |
| Mean | 43.0% | 48.4% |
| Median | 44.0% | 48.8% |
| Interquartile 25% (IQ1) | 39.4% | 43.1% |
| Interquartile 75% (IQ3) | 46.8% | 54.5% |
| Interquartile Range (IQR) | 7.4% | 11.5% |
| Standard Deviation (Sample) | 10.3% | 13.0% |
| Standard Deviation (Population) | 10.2% | 12.9% |
Similar Demographics by Disability Age Over 75
Demographics Similar to Immigrants from Bolivia by Disability Age Over 75
In terms of disability age over 75, the demographic groups most similar to Immigrants from Bolivia are Polish (45.3%, a difference of 0.040%), Macedonian (45.4%, a difference of 0.040%), Immigrants from Poland (45.4%, a difference of 0.050%), Immigrants from Switzerland (45.3%, a difference of 0.070%), and Thai (45.4%, a difference of 0.070%).
| Demographics | Rating | Rank | Disability Age Over 75 |
| Bolivians | 100.0 /100 | #18 | Exceptional 45.2% |
| Immigrants | Greece | 100.0 /100 | #19 | Exceptional 45.2% |
| Immigrants | Serbia | 100.0 /100 | #20 | Exceptional 45.3% |
| Immigrants | Belgium | 100.0 /100 | #21 | Exceptional 45.3% |
| Immigrants | South Africa | 100.0 /100 | #22 | Exceptional 45.3% |
| Immigrants | Switzerland | 99.9 /100 | #23 | Exceptional 45.3% |
| Poles | 99.9 /100 | #24 | Exceptional 45.3% |
| Immigrants | Bolivia | 99.9 /100 | #25 | Exceptional 45.4% |
| Macedonians | 99.9 /100 | #26 | Exceptional 45.4% |
| Immigrants | Poland | 99.9 /100 | #27 | Exceptional 45.4% |
| Thais | 99.9 /100 | #28 | Exceptional 45.4% |
| Filipinos | 99.9 /100 | #29 | Exceptional 45.4% |
| Immigrants | Denmark | 99.9 /100 | #30 | Exceptional 45.4% |
| Immigrants | Bulgaria | 99.9 /100 | #31 | Exceptional 45.5% |
| Immigrants | Australia | 99.9 /100 | #32 | Exceptional 45.5% |
Demographics Similar to Guatemalans by Disability Age Over 75
In terms of disability age over 75, the demographic groups most similar to Guatemalans are Malaysian (49.0%, a difference of 0.020%), Immigrants from El Salvador (49.0%, a difference of 0.020%), Potawatomi (49.0%, a difference of 0.050%), Fijian (49.0%, a difference of 0.070%), and Assyrian/Chaldean/Syriac (49.1%, a difference of 0.080%).
| Demographics | Rating | Rank | Disability Age Over 75 |
| Africans | 0.3 /100 | #261 | Tragic 48.9% |
| Immigrants | West Indies | 0.3 /100 | #262 | Tragic 48.9% |
| Salvadorans | 0.3 /100 | #263 | Tragic 48.9% |
| Immigrants | Honduras | 0.3 /100 | #264 | Tragic 48.9% |
| Hondurans | 0.3 /100 | #265 | Tragic 48.9% |
| U.S. Virgin Islanders | 0.2 /100 | #266 | Tragic 48.9% |
| Malaysians | 0.2 /100 | #267 | Tragic 49.0% |
| Guatemalans | 0.2 /100 | #268 | Tragic 49.0% |
| Immigrants | El Salvador | 0.2 /100 | #269 | Tragic 49.0% |
| Potawatomi | 0.2 /100 | #270 | Tragic 49.0% |
| Fijians | 0.2 /100 | #271 | Tragic 49.0% |
| Assyrians/Chaldeans/Syriacs | 0.2 /100 | #272 | Tragic 49.1% |
| Immigrants | Iraq | 0.1 /100 | #273 | Tragic 49.1% |
| Immigrants | Guatemala | 0.1 /100 | #274 | Tragic 49.1% |
| Immigrants | Dominica | 0.1 /100 | #275 | Tragic 49.1% |