Immigrants from Ecuador vs Guatemalan Disability Age Over 75
COMPARE
Immigrants from Ecuador
Guatemalan
Disability Age Over 75
Disability Age Over 75 Comparison
Immigrants from Ecuador
Guatemalans
47.4%
DISABILITY AGE OVER 75
41.7/ 100
METRIC RATING
180th/ 347
METRIC RANK
49.0%
DISABILITY AGE OVER 75
0.2/ 100
METRIC RATING
268th/ 347
METRIC RANK
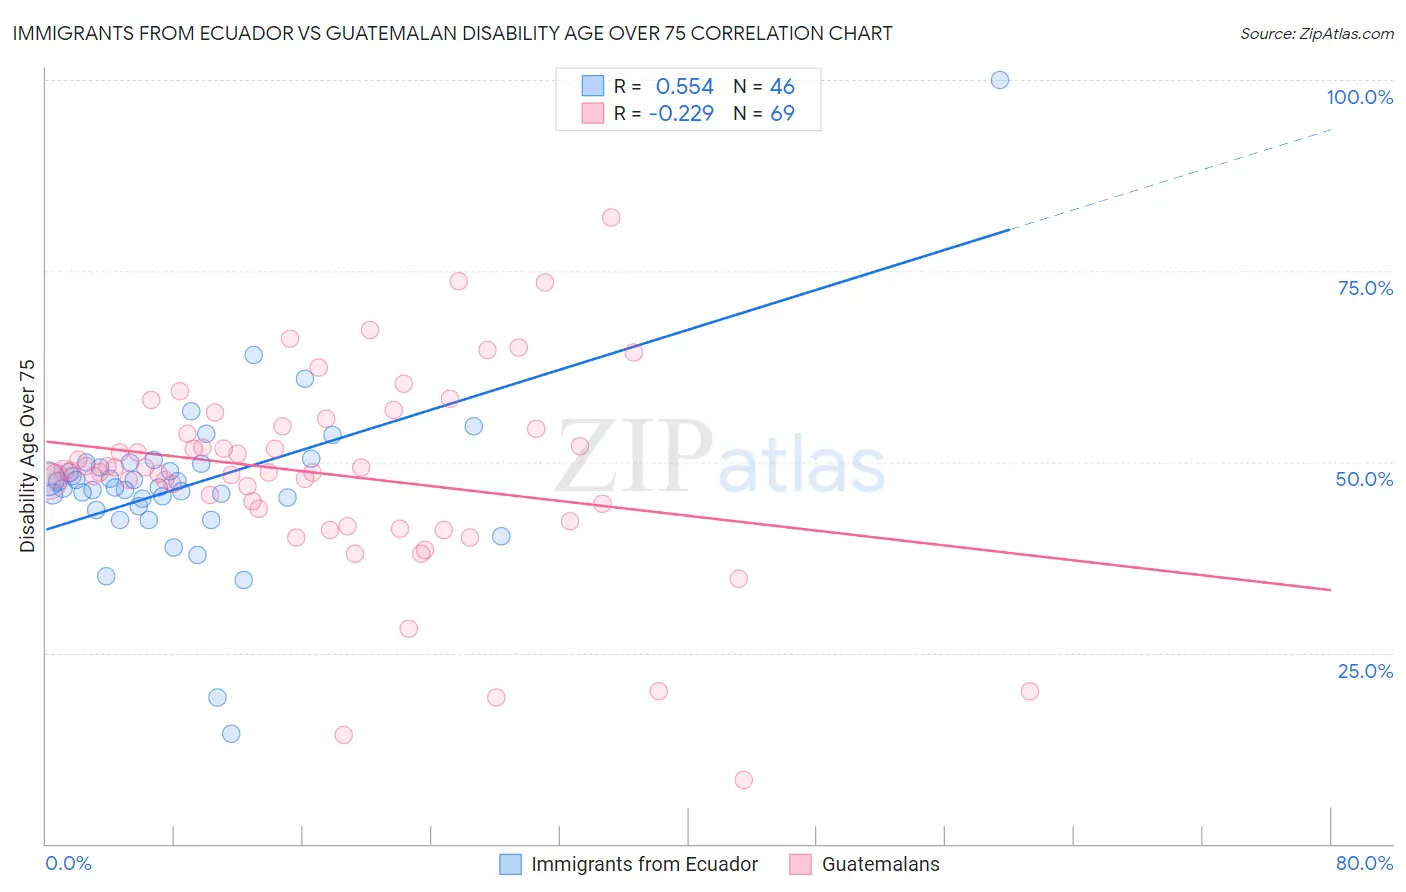
Immigrants from Ecuador vs Guatemalan Disability Age Over 75 Correlation Chart
The statistical analysis conducted on geographies consisting of 270,547,812 people shows a substantial positive correlation between the proportion of Immigrants from Ecuador and percentage of population with a disability over the age of 75 in the United States with a correlation coefficient (R) of 0.554 and weighted average of 47.4%. Similarly, the statistical analysis conducted on geographies consisting of 408,753,753 people shows a weak negative correlation between the proportion of Guatemalans and percentage of population with a disability over the age of 75 in the United States with a correlation coefficient (R) of -0.229 and weighted average of 49.0%, a difference of 3.3%.
Disability Age Over 75 Correlation Summary
| Measurement | Immigrants from Ecuador | Guatemalan |
| Minimum | 14.5% | 8.3% |
| Maximum | 100.0% | 82.1% |
| Range | 85.5% | 73.7% |
| Mean | 47.0% | 48.4% |
| Median | 46.6% | 48.8% |
| Interquartile 25% (IQ1) | 44.1% | 43.1% |
| Interquartile 75% (IQ3) | 49.7% | 54.5% |
| Interquartile Range (IQR) | 5.5% | 11.5% |
| Standard Deviation (Sample) | 11.6% | 13.0% |
| Standard Deviation (Population) | 11.4% | 12.9% |
Similar Demographics by Disability Age Over 75
Demographics Similar to Immigrants from Ecuador by Disability Age Over 75
In terms of disability age over 75, the demographic groups most similar to Immigrants from Ecuador are Sierra Leonean (47.4%, a difference of 0.0%), Cuban (47.4%, a difference of 0.010%), Immigrants from Kazakhstan (47.4%, a difference of 0.030%), Immigrants from Moldova (47.4%, a difference of 0.040%), and Delaware (47.5%, a difference of 0.060%).
| Demographics | Rating | Rank | Disability Age Over 75 |
| Alsatians | 51.9 /100 | #173 | Average 47.3% |
| Whites/Caucasians | 50.0 /100 | #174 | Average 47.3% |
| Immigrants | Haiti | 49.7 /100 | #175 | Average 47.3% |
| Ecuadorians | 46.7 /100 | #176 | Average 47.4% |
| Haitians | 44.6 /100 | #177 | Average 47.4% |
| Cubans | 42.1 /100 | #178 | Average 47.4% |
| Sierra Leoneans | 41.7 /100 | #179 | Average 47.4% |
| Immigrants | Ecuador | 41.7 /100 | #180 | Average 47.4% |
| Immigrants | Kazakhstan | 40.4 /100 | #181 | Average 47.4% |
| Immigrants | Moldova | 39.9 /100 | #182 | Fair 47.4% |
| Delaware | 39.1 /100 | #183 | Fair 47.5% |
| Immigrants | Nigeria | 34.0 /100 | #184 | Fair 47.5% |
| Ghanaians | 33.0 /100 | #185 | Fair 47.5% |
| Sudanese | 32.0 /100 | #186 | Fair 47.5% |
| Immigrants | Sudan | 31.8 /100 | #187 | Fair 47.5% |
Demographics Similar to Guatemalans by Disability Age Over 75
In terms of disability age over 75, the demographic groups most similar to Guatemalans are Malaysian (49.0%, a difference of 0.020%), Immigrants from El Salvador (49.0%, a difference of 0.020%), Potawatomi (49.0%, a difference of 0.050%), Fijian (49.0%, a difference of 0.070%), and Assyrian/Chaldean/Syriac (49.1%, a difference of 0.080%).
| Demographics | Rating | Rank | Disability Age Over 75 |
| Africans | 0.3 /100 | #261 | Tragic 48.9% |
| Immigrants | West Indies | 0.3 /100 | #262 | Tragic 48.9% |
| Salvadorans | 0.3 /100 | #263 | Tragic 48.9% |
| Immigrants | Honduras | 0.3 /100 | #264 | Tragic 48.9% |
| Hondurans | 0.3 /100 | #265 | Tragic 48.9% |
| U.S. Virgin Islanders | 0.2 /100 | #266 | Tragic 48.9% |
| Malaysians | 0.2 /100 | #267 | Tragic 49.0% |
| Guatemalans | 0.2 /100 | #268 | Tragic 49.0% |
| Immigrants | El Salvador | 0.2 /100 | #269 | Tragic 49.0% |
| Potawatomi | 0.2 /100 | #270 | Tragic 49.0% |
| Fijians | 0.2 /100 | #271 | Tragic 49.0% |
| Assyrians/Chaldeans/Syriacs | 0.2 /100 | #272 | Tragic 49.1% |
| Immigrants | Iraq | 0.1 /100 | #273 | Tragic 49.1% |
| Immigrants | Guatemala | 0.1 /100 | #274 | Tragic 49.1% |
| Immigrants | Dominica | 0.1 /100 | #275 | Tragic 49.1% |