Immigrants from Kuwait vs European Disability Age Over 75
COMPARE
Immigrants from Kuwait
European
Disability Age Over 75
Disability Age Over 75 Comparison
Immigrants from Kuwait
Europeans
46.4%
DISABILITY AGE OVER 75
96.8/ 100
METRIC RATING
106th/ 347
METRIC RANK
46.7%
DISABILITY AGE OVER 75
91.2/ 100
METRIC RATING
126th/ 347
METRIC RANK
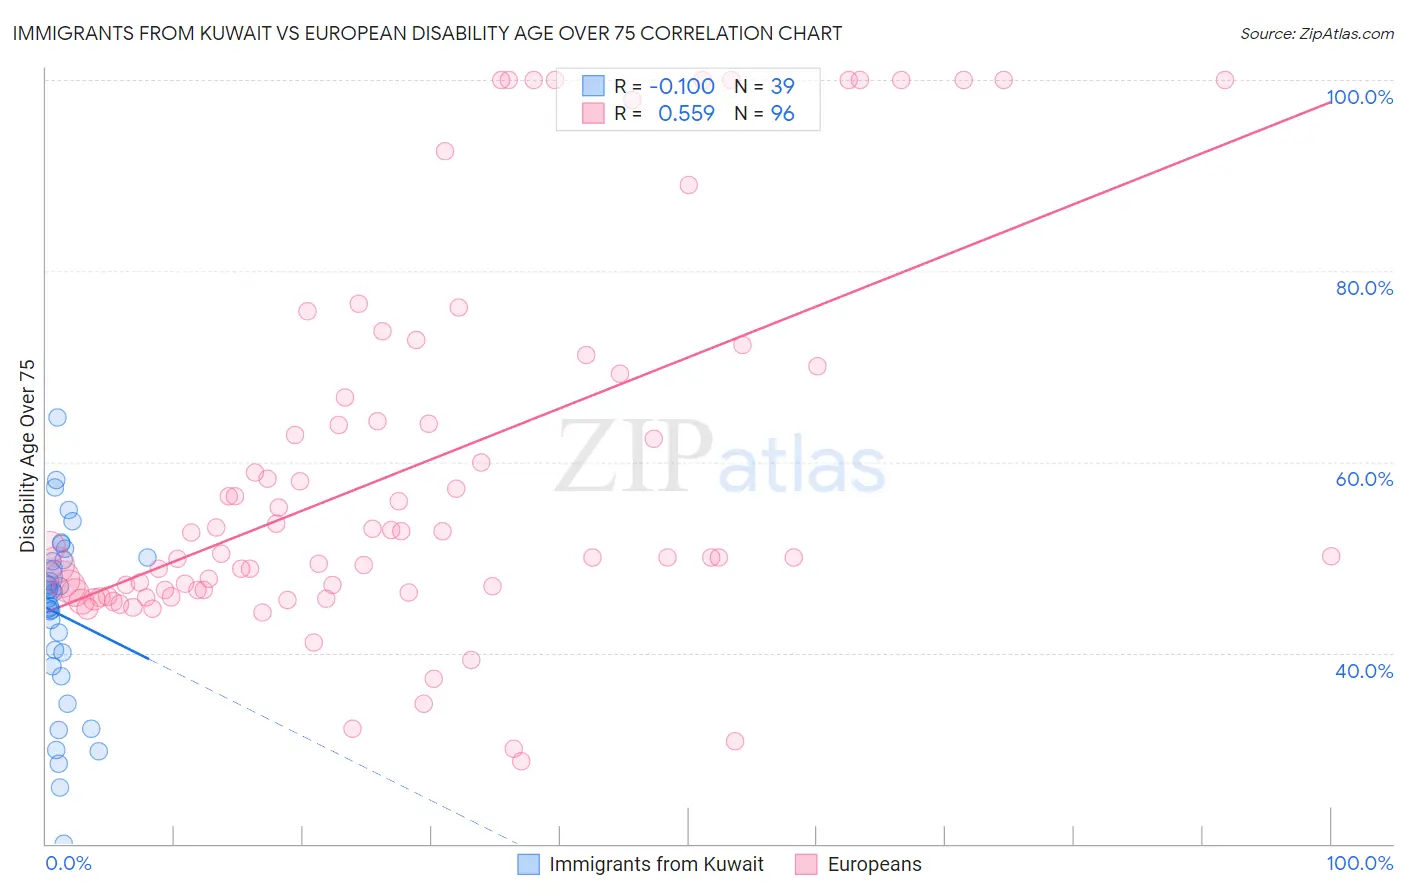
Immigrants from Kuwait vs European Disability Age Over 75 Correlation Chart
The statistical analysis conducted on geographies consisting of 136,863,821 people shows a slight negative correlation between the proportion of Immigrants from Kuwait and percentage of population with a disability over the age of 75 in the United States with a correlation coefficient (R) of -0.100 and weighted average of 46.4%. Similarly, the statistical analysis conducted on geographies consisting of 559,923,693 people shows a substantial positive correlation between the proportion of Europeans and percentage of population with a disability over the age of 75 in the United States with a correlation coefficient (R) of 0.559 and weighted average of 46.7%, a difference of 0.62%.
Disability Age Over 75 Correlation Summary
| Measurement | Immigrants from Kuwait | European |
| Minimum | 20.1% | 28.7% |
| Maximum | 64.6% | 100.0% |
| Range | 44.6% | 71.3% |
| Mean | 44.0% | 59.1% |
| Median | 46.3% | 50.2% |
| Interquartile 25% (IQ1) | 38.6% | 46.5% |
| Interquartile 75% (IQ3) | 49.7% | 68.0% |
| Interquartile Range (IQR) | 11.1% | 21.5% |
| Standard Deviation (Sample) | 9.5% | 19.7% |
| Standard Deviation (Population) | 9.4% | 19.6% |
Demographics Similar to Immigrants from Kuwait and Europeans by Disability Age Over 75
In terms of disability age over 75, the demographic groups most similar to Immigrants from Kuwait are Immigrants from Uruguay (46.4%, a difference of 0.030%), Brazilian (46.5%, a difference of 0.040%), Chilean (46.5%, a difference of 0.070%), Immigrants from Hong Kong (46.5%, a difference of 0.080%), and Immigrants from Chile (46.5%, a difference of 0.080%). Similarly, the demographic groups most similar to Europeans are Colombian (46.7%, a difference of 0.010%), Immigrants from South America (46.7%, a difference of 0.040%), Immigrants from Colombia (46.7%, a difference of 0.10%), Immigrants from Albania (46.6%, a difference of 0.15%), and Scandinavian (46.6%, a difference of 0.20%).
| Demographics | Rating | Rank | Disability Age Over 75 |
| Immigrants | Kuwait | 96.8 /100 | #106 | Exceptional 46.4% |
| Immigrants | Uruguay | 96.7 /100 | #107 | Exceptional 46.4% |
| Brazilians | 96.6 /100 | #108 | Exceptional 46.5% |
| Chileans | 96.4 /100 | #109 | Exceptional 46.5% |
| Immigrants | Hong Kong | 96.4 /100 | #110 | Exceptional 46.5% |
| Immigrants | Chile | 96.4 /100 | #111 | Exceptional 46.5% |
| Immigrants | Pakistan | 96.1 /100 | #112 | Exceptional 46.5% |
| Irish | 96.0 /100 | #113 | Exceptional 46.5% |
| Dutch | 95.9 /100 | #114 | Exceptional 46.5% |
| British | 95.7 /100 | #115 | Exceptional 46.5% |
| Indians (Asian) | 95.7 /100 | #116 | Exceptional 46.5% |
| Hungarians | 95.3 /100 | #117 | Exceptional 46.5% |
| Czechoslovakians | 94.7 /100 | #118 | Exceptional 46.6% |
| Canadians | 94.4 /100 | #119 | Exceptional 46.6% |
| Immigrants | Nepal | 94.1 /100 | #120 | Exceptional 46.6% |
| Scandinavians | 93.6 /100 | #121 | Exceptional 46.6% |
| Immigrants | Albania | 93.2 /100 | #122 | Exceptional 46.6% |
| Immigrants | Colombia | 92.6 /100 | #123 | Exceptional 46.7% |
| Immigrants | South America | 91.8 /100 | #124 | Exceptional 46.7% |
| Colombians | 91.3 /100 | #125 | Exceptional 46.7% |
| Europeans | 91.2 /100 | #126 | Exceptional 46.7% |