Taiwanese vs European Disability Age Over 75
COMPARE
Taiwanese
European
Disability Age Over 75
Disability Age Over 75 Comparison
Taiwanese
Europeans
48.2%
DISABILITY AGE OVER 75
4.4/ 100
METRIC RATING
230th/ 347
METRIC RANK
46.7%
DISABILITY AGE OVER 75
91.2/ 100
METRIC RATING
126th/ 347
METRIC RANK
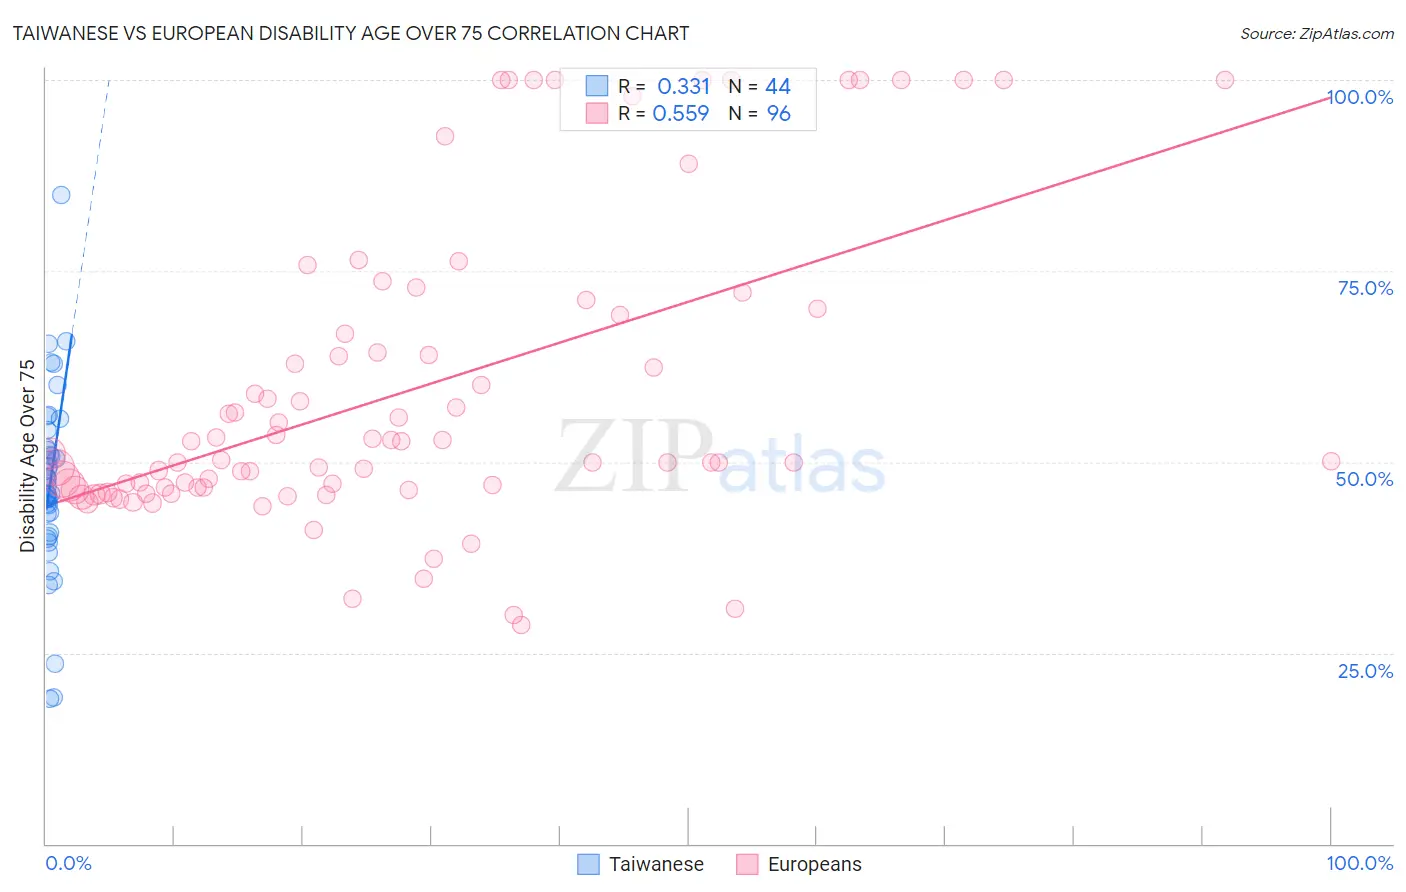
Taiwanese vs European Disability Age Over 75 Correlation Chart
The statistical analysis conducted on geographies consisting of 31,709,765 people shows a mild positive correlation between the proportion of Taiwanese and percentage of population with a disability over the age of 75 in the United States with a correlation coefficient (R) of 0.331 and weighted average of 48.2%. Similarly, the statistical analysis conducted on geographies consisting of 559,923,693 people shows a substantial positive correlation between the proportion of Europeans and percentage of population with a disability over the age of 75 in the United States with a correlation coefficient (R) of 0.559 and weighted average of 46.7%, a difference of 3.1%.
Disability Age Over 75 Correlation Summary
| Measurement | Taiwanese | European |
| Minimum | 19.0% | 28.7% |
| Maximum | 85.0% | 100.0% |
| Range | 66.0% | 71.3% |
| Mean | 47.2% | 59.1% |
| Median | 46.3% | 50.2% |
| Interquartile 25% (IQ1) | 42.0% | 46.5% |
| Interquartile 75% (IQ3) | 51.7% | 68.0% |
| Interquartile Range (IQR) | 9.7% | 21.5% |
| Standard Deviation (Sample) | 11.9% | 19.7% |
| Standard Deviation (Population) | 11.8% | 19.6% |
Similar Demographics by Disability Age Over 75
Demographics Similar to Taiwanese by Disability Age Over 75
In terms of disability age over 75, the demographic groups most similar to Taiwanese are Immigrants (48.2%, a difference of 0.010%), Indonesian (48.2%, a difference of 0.030%), Cree (48.2%, a difference of 0.030%), Subsaharan African (48.2%, a difference of 0.090%), and Hmong (48.2%, a difference of 0.090%).
| Demographics | Rating | Rank | Disability Age Over 75 |
| Immigrants | Bangladesh | 6.8 /100 | #223 | Tragic 48.0% |
| Liberians | 6.7 /100 | #224 | Tragic 48.0% |
| Spanish | 6.5 /100 | #225 | Tragic 48.0% |
| Immigrants | Nonimmigrants | 6.5 /100 | #226 | Tragic 48.0% |
| Zimbabweans | 6.4 /100 | #227 | Tragic 48.1% |
| Immigrants | Liberia | 5.9 /100 | #228 | Tragic 48.1% |
| Spaniards | 5.7 /100 | #229 | Tragic 48.1% |
| Taiwanese | 4.4 /100 | #230 | Tragic 48.2% |
| Immigrants | Immigrants | 4.3 /100 | #231 | Tragic 48.2% |
| Indonesians | 4.2 /100 | #232 | Tragic 48.2% |
| Cree | 4.2 /100 | #233 | Tragic 48.2% |
| Sub-Saharan Africans | 3.8 /100 | #234 | Tragic 48.2% |
| Hmong | 3.8 /100 | #235 | Tragic 48.2% |
| Immigrants | Nicaragua | 3.2 /100 | #236 | Tragic 48.2% |
| Immigrants | St. Vincent and the Grenadines | 3.2 /100 | #237 | Tragic 48.2% |
Demographics Similar to Europeans by Disability Age Over 75
In terms of disability age over 75, the demographic groups most similar to Europeans are Colombian (46.7%, a difference of 0.010%), Syrian (46.7%, a difference of 0.010%), Icelander (46.7%, a difference of 0.020%), Immigrants from Germany (46.7%, a difference of 0.030%), and Immigrants from South America (46.7%, a difference of 0.040%).
| Demographics | Rating | Rank | Disability Age Over 75 |
| Canadians | 94.4 /100 | #119 | Exceptional 46.6% |
| Immigrants | Nepal | 94.1 /100 | #120 | Exceptional 46.6% |
| Scandinavians | 93.6 /100 | #121 | Exceptional 46.6% |
| Immigrants | Albania | 93.2 /100 | #122 | Exceptional 46.6% |
| Immigrants | Colombia | 92.6 /100 | #123 | Exceptional 46.7% |
| Immigrants | South America | 91.8 /100 | #124 | Exceptional 46.7% |
| Colombians | 91.3 /100 | #125 | Exceptional 46.7% |
| Europeans | 91.2 /100 | #126 | Exceptional 46.7% |
| Syrians | 91.1 /100 | #127 | Exceptional 46.7% |
| Icelanders | 90.9 /100 | #128 | Exceptional 46.7% |
| Immigrants | Germany | 90.8 /100 | #129 | Exceptional 46.7% |
| Immigrants | Northern Africa | 90.7 /100 | #130 | Exceptional 46.7% |
| Scottish | 90.5 /100 | #131 | Exceptional 46.7% |
| South Americans | 90.0 /100 | #132 | Excellent 46.8% |
| English | 89.4 /100 | #133 | Excellent 46.8% |