Immigrants from Micronesia vs Chickasaw Disability Age Over 75
COMPARE
Immigrants from Micronesia
Chickasaw
Disability Age Over 75
Disability Age Over 75 Comparison
Immigrants from Micronesia
Chickasaw
50.1%
DISABILITY AGE OVER 75
0.0/ 100
METRIC RATING
299th/ 347
METRIC RANK
51.2%
DISABILITY AGE OVER 75
0.0/ 100
METRIC RATING
316th/ 347
METRIC RANK
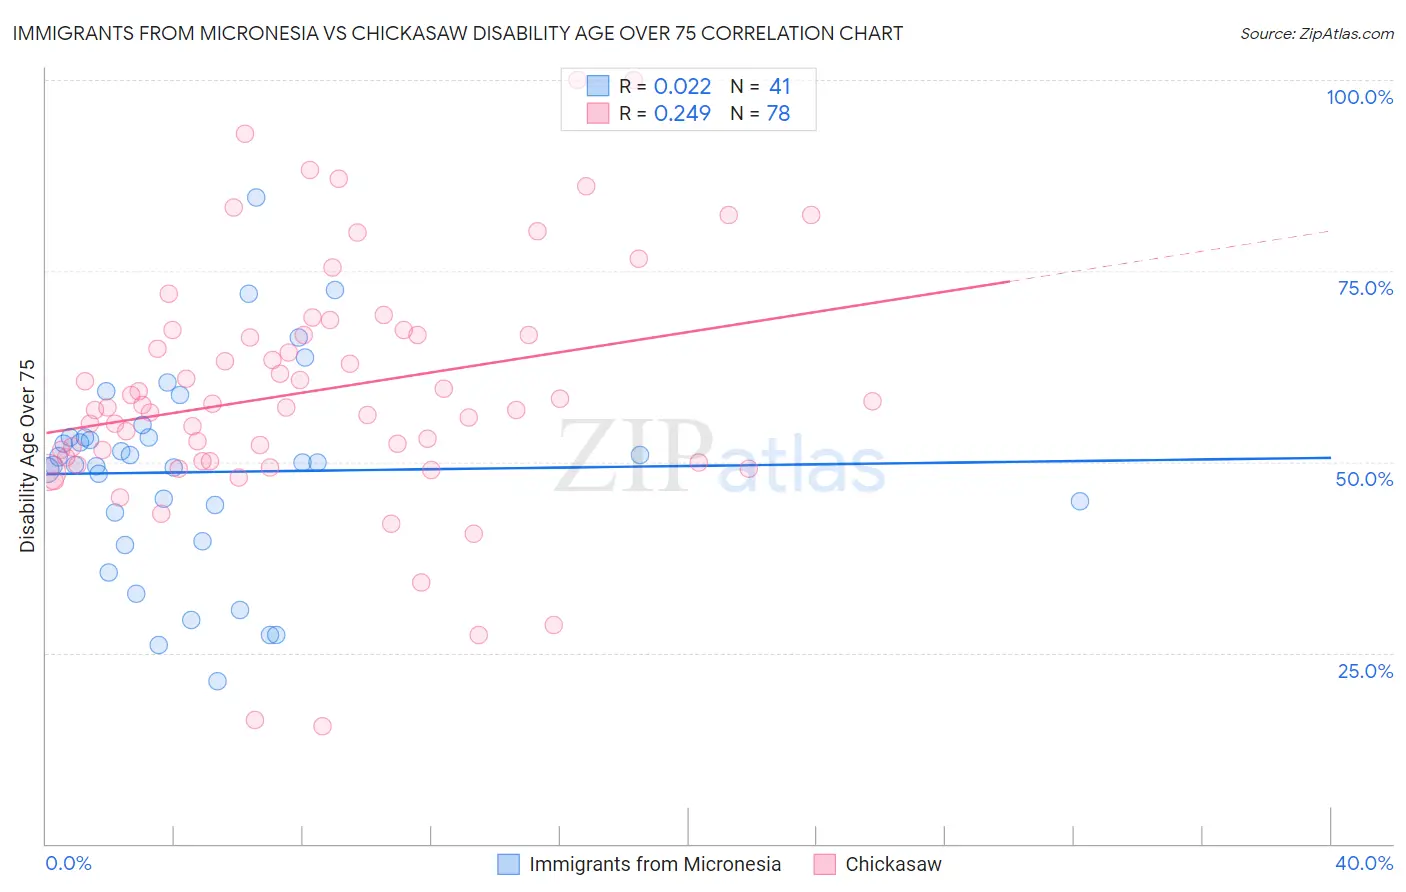
Immigrants from Micronesia vs Chickasaw Disability Age Over 75 Correlation Chart
The statistical analysis conducted on geographies consisting of 61,409,070 people shows no correlation between the proportion of Immigrants from Micronesia and percentage of population with a disability over the age of 75 in the United States with a correlation coefficient (R) of 0.022 and weighted average of 50.1%. Similarly, the statistical analysis conducted on geographies consisting of 147,558,416 people shows a weak positive correlation between the proportion of Chickasaw and percentage of population with a disability over the age of 75 in the United States with a correlation coefficient (R) of 0.249 and weighted average of 51.2%, a difference of 2.2%.
Disability Age Over 75 Correlation Summary
| Measurement | Immigrants from Micronesia | Chickasaw |
| Minimum | 21.2% | 15.4% |
| Maximum | 84.7% | 100.0% |
| Range | 63.5% | 84.6% |
| Mean | 48.7% | 59.3% |
| Median | 49.9% | 57.3% |
| Interquartile 25% (IQ1) | 41.5% | 50.1% |
| Interquartile 75% (IQ3) | 53.2% | 66.7% |
| Interquartile Range (IQR) | 11.7% | 16.6% |
| Standard Deviation (Sample) | 13.3% | 16.1% |
| Standard Deviation (Population) | 13.1% | 16.0% |
Demographics Similar to Immigrants from Micronesia and Chickasaw by Disability Age Over 75
In terms of disability age over 75, the demographic groups most similar to Immigrants from Micronesia are Cape Verdean (50.1%, a difference of 0.040%), Marshallese (50.1%, a difference of 0.070%), Dominican (50.2%, a difference of 0.090%), Armenian (50.0%, a difference of 0.12%), and Cherokee (50.2%, a difference of 0.25%). Similarly, the demographic groups most similar to Chickasaw are Mexican (51.1%, a difference of 0.14%), Yakama (51.3%, a difference of 0.18%), Immigrants from Mexico (51.1%, a difference of 0.19%), Immigrants from the Azores (50.9%, a difference of 0.56%), and Cheyenne (50.9%, a difference of 0.61%).
| Demographics | Rating | Rank | Disability Age Over 75 |
| Armenians | 0.0 /100 | #297 | Tragic 50.0% |
| Marshallese | 0.0 /100 | #298 | Tragic 50.1% |
| Immigrants | Micronesia | 0.0 /100 | #299 | Tragic 50.1% |
| Cape Verdeans | 0.0 /100 | #300 | Tragic 50.1% |
| Dominicans | 0.0 /100 | #301 | Tragic 50.2% |
| Cherokee | 0.0 /100 | #302 | Tragic 50.2% |
| Japanese | 0.0 /100 | #303 | Tragic 50.2% |
| Immigrants | Dominican Republic | 0.0 /100 | #304 | Tragic 50.3% |
| Central American Indians | 0.0 /100 | #305 | Tragic 50.5% |
| Immigrants | Central America | 0.0 /100 | #306 | Tragic 50.5% |
| Immigrants | Fiji | 0.0 /100 | #307 | Tragic 50.6% |
| Hispanics or Latinos | 0.0 /100 | #308 | Tragic 50.6% |
| Aleuts | 0.0 /100 | #309 | Tragic 50.6% |
| Tlingit-Haida | 0.0 /100 | #310 | Tragic 50.6% |
| Cajuns | 0.0 /100 | #311 | Tragic 50.7% |
| Cheyenne | 0.0 /100 | #312 | Tragic 50.9% |
| Immigrants | Azores | 0.0 /100 | #313 | Tragic 50.9% |
| Immigrants | Mexico | 0.0 /100 | #314 | Tragic 51.1% |
| Mexicans | 0.0 /100 | #315 | Tragic 51.1% |
| Chickasaw | 0.0 /100 | #316 | Tragic 51.2% |
| Yakama | 0.0 /100 | #317 | Tragic 51.3% |