Osage vs Immigrants from Somalia Male Disability
COMPARE
Osage
Immigrants from Somalia
Male Disability
Male Disability Comparison
Osage
Immigrants from Somalia
14.0%
MALE DISABILITY
0.0/ 100
METRIC RATING
323rd/ 347
METRIC RANK
11.5%
MALE DISABILITY
10.4/ 100
METRIC RATING
207th/ 347
METRIC RANK
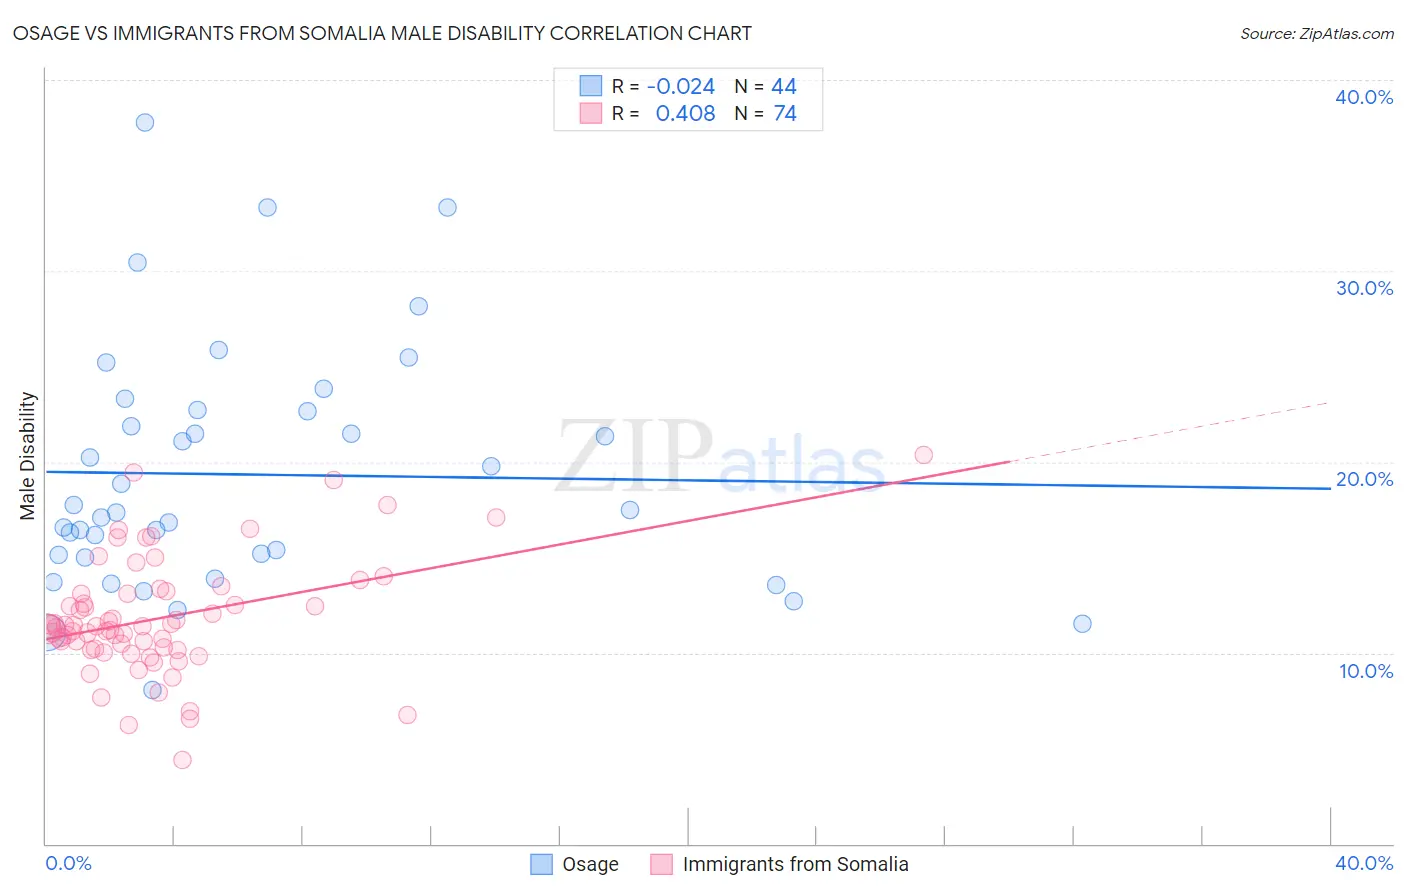
Osage vs Immigrants from Somalia Male Disability Correlation Chart
The statistical analysis conducted on geographies consisting of 91,798,879 people shows no correlation between the proportion of Osage and percentage of males with a disability in the United States with a correlation coefficient (R) of -0.024 and weighted average of 14.0%. Similarly, the statistical analysis conducted on geographies consisting of 92,107,608 people shows a moderate positive correlation between the proportion of Immigrants from Somalia and percentage of males with a disability in the United States with a correlation coefficient (R) of 0.408 and weighted average of 11.5%, a difference of 21.3%.
Male Disability Correlation Summary
| Measurement | Osage | Immigrants from Somalia |
| Minimum | 8.0% | 4.4% |
| Maximum | 37.7% | 20.4% |
| Range | 29.7% | 16.0% |
| Mean | 19.3% | 11.8% |
| Median | 17.4% | 11.4% |
| Interquartile 25% (IQ1) | 15.1% | 10.2% |
| Interquartile 75% (IQ3) | 22.7% | 13.1% |
| Interquartile Range (IQR) | 7.6% | 2.9% |
| Standard Deviation (Sample) | 6.4% | 3.0% |
| Standard Deviation (Population) | 6.4% | 3.0% |
Similar Demographics by Male Disability
Demographics Similar to Osage by Male Disability
In terms of male disability, the demographic groups most similar to Osage are Apache (14.0%, a difference of 0.070%), Comanche (14.1%, a difference of 0.33%), Ottawa (14.1%, a difference of 0.44%), Shoshone (13.8%, a difference of 1.2%), and Tlingit-Haida (13.8%, a difference of 1.3%).
| Demographics | Rating | Rank | Male Disability |
| Alaska Natives | 0.0 /100 | #316 | Tragic 13.6% |
| Paiute | 0.0 /100 | #317 | Tragic 13.7% |
| Cree | 0.0 /100 | #318 | Tragic 13.7% |
| Americans | 0.0 /100 | #319 | Tragic 13.8% |
| Tlingit-Haida | 0.0 /100 | #320 | Tragic 13.8% |
| Shoshone | 0.0 /100 | #321 | Tragic 13.8% |
| Apache | 0.0 /100 | #322 | Tragic 14.0% |
| Osage | 0.0 /100 | #323 | Tragic 14.0% |
| Comanche | 0.0 /100 | #324 | Tragic 14.1% |
| Ottawa | 0.0 /100 | #325 | Tragic 14.1% |
| Natives/Alaskans | 0.0 /100 | #326 | Tragic 14.2% |
| Potawatomi | 0.0 /100 | #327 | Tragic 14.2% |
| Chippewa | 0.0 /100 | #328 | Tragic 14.3% |
| Cajuns | 0.0 /100 | #329 | Tragic 14.4% |
| Navajo | 0.0 /100 | #330 | Tragic 14.4% |
Demographics Similar to Immigrants from Somalia by Male Disability
In terms of male disability, the demographic groups most similar to Immigrants from Somalia are Ukrainian (11.5%, a difference of 0.030%), Serbian (11.5%, a difference of 0.040%), Icelander (11.6%, a difference of 0.040%), Immigrants from Cambodia (11.5%, a difference of 0.050%), and Spanish American Indian (11.6%, a difference of 0.050%).
| Demographics | Rating | Rank | Male Disability |
| Immigrants | Iraq | 13.0 /100 | #200 | Poor 11.5% |
| Immigrants | Panama | 13.0 /100 | #201 | Poor 11.5% |
| Immigrants | Mexico | 12.6 /100 | #202 | Poor 11.5% |
| Jamaicans | 10.9 /100 | #203 | Poor 11.5% |
| Immigrants | Cambodia | 10.8 /100 | #204 | Poor 11.5% |
| Serbians | 10.7 /100 | #205 | Poor 11.5% |
| Ukrainians | 10.6 /100 | #206 | Poor 11.5% |
| Immigrants | Somalia | 10.4 /100 | #207 | Poor 11.5% |
| Icelanders | 10.1 /100 | #208 | Poor 11.6% |
| Spanish American Indians | 10.1 /100 | #209 | Poor 11.6% |
| Ute | 9.4 /100 | #210 | Tragic 11.6% |
| Immigrants | Thailand | 8.4 /100 | #211 | Tragic 11.6% |
| Immigrants | Scotland | 8.2 /100 | #212 | Tragic 11.6% |
| Mexican American Indians | 7.8 /100 | #213 | Tragic 11.6% |
| Lithuanians | 6.6 /100 | #214 | Tragic 11.6% |