Osage vs Norwegian Male Disability
COMPARE
Osage
Norwegian
Male Disability
Male Disability Comparison
Osage
Norwegians
14.0%
MALE DISABILITY
0.0/ 100
METRIC RATING
323rd/ 347
METRIC RANK
12.2%
MALE DISABILITY
0.2/ 100
METRIC RATING
262nd/ 347
METRIC RANK
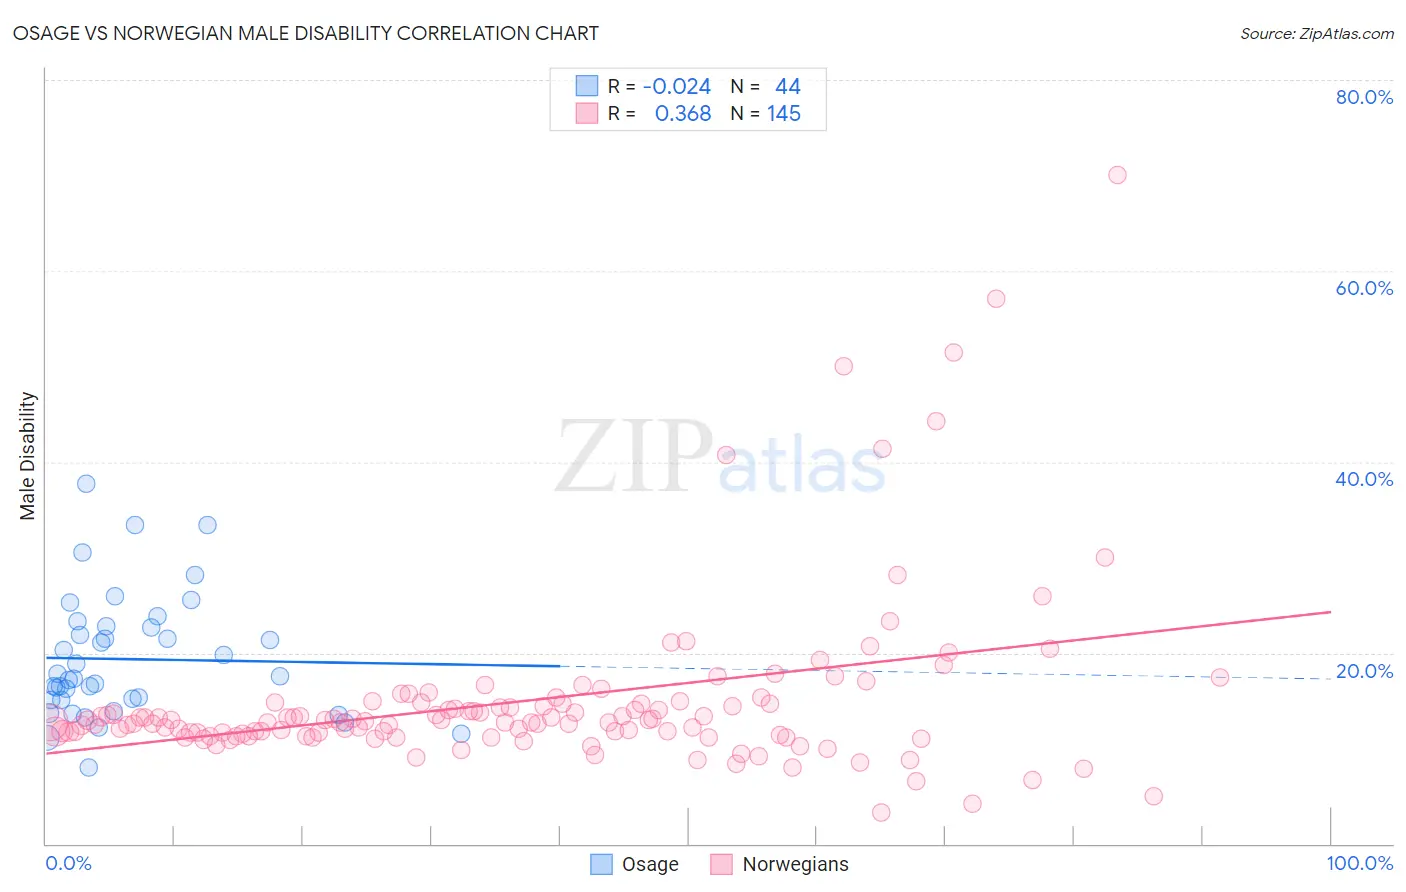
Osage vs Norwegian Male Disability Correlation Chart
The statistical analysis conducted on geographies consisting of 91,798,879 people shows no correlation between the proportion of Osage and percentage of males with a disability in the United States with a correlation coefficient (R) of -0.024 and weighted average of 14.0%. Similarly, the statistical analysis conducted on geographies consisting of 533,169,382 people shows a mild positive correlation between the proportion of Norwegians and percentage of males with a disability in the United States with a correlation coefficient (R) of 0.368 and weighted average of 12.2%, a difference of 15.1%.
Male Disability Correlation Summary
| Measurement | Osage | Norwegian |
| Minimum | 8.0% | 3.3% |
| Maximum | 37.7% | 70.0% |
| Range | 29.7% | 66.7% |
| Mean | 19.3% | 15.0% |
| Median | 17.4% | 12.8% |
| Interquartile 25% (IQ1) | 15.1% | 11.5% |
| Interquartile 75% (IQ3) | 22.7% | 14.7% |
| Interquartile Range (IQR) | 7.6% | 3.2% |
| Standard Deviation (Sample) | 6.4% | 9.1% |
| Standard Deviation (Population) | 6.4% | 9.1% |
Similar Demographics by Male Disability
Demographics Similar to Osage by Male Disability
In terms of male disability, the demographic groups most similar to Osage are Apache (14.0%, a difference of 0.070%), Comanche (14.1%, a difference of 0.33%), Ottawa (14.1%, a difference of 0.44%), Shoshone (13.8%, a difference of 1.2%), and Tlingit-Haida (13.8%, a difference of 1.3%).
| Demographics | Rating | Rank | Male Disability |
| Alaska Natives | 0.0 /100 | #316 | Tragic 13.6% |
| Paiute | 0.0 /100 | #317 | Tragic 13.7% |
| Cree | 0.0 /100 | #318 | Tragic 13.7% |
| Americans | 0.0 /100 | #319 | Tragic 13.8% |
| Tlingit-Haida | 0.0 /100 | #320 | Tragic 13.8% |
| Shoshone | 0.0 /100 | #321 | Tragic 13.8% |
| Apache | 0.0 /100 | #322 | Tragic 14.0% |
| Osage | 0.0 /100 | #323 | Tragic 14.0% |
| Comanche | 0.0 /100 | #324 | Tragic 14.1% |
| Ottawa | 0.0 /100 | #325 | Tragic 14.1% |
| Natives/Alaskans | 0.0 /100 | #326 | Tragic 14.2% |
| Potawatomi | 0.0 /100 | #327 | Tragic 14.2% |
| Chippewa | 0.0 /100 | #328 | Tragic 14.3% |
| Cajuns | 0.0 /100 | #329 | Tragic 14.4% |
| Navajo | 0.0 /100 | #330 | Tragic 14.4% |
Demographics Similar to Norwegians by Male Disability
In terms of male disability, the demographic groups most similar to Norwegians are Slavic (12.2%, a difference of 0.010%), Canadian (12.2%, a difference of 0.20%), Nepalese (12.2%, a difference of 0.23%), Swedish (12.1%, a difference of 0.37%), and Belgian (12.1%, a difference of 0.44%).
| Demographics | Rating | Rank | Male Disability |
| Chinese | 0.4 /100 | #255 | Tragic 12.1% |
| Swiss | 0.3 /100 | #256 | Tragic 12.1% |
| Europeans | 0.3 /100 | #257 | Tragic 12.1% |
| Basques | 0.3 /100 | #258 | Tragic 12.1% |
| Belgians | 0.3 /100 | #259 | Tragic 12.1% |
| Swedes | 0.3 /100 | #260 | Tragic 12.1% |
| Slavs | 0.2 /100 | #261 | Tragic 12.2% |
| Norwegians | 0.2 /100 | #262 | Tragic 12.2% |
| Canadians | 0.2 /100 | #263 | Tragic 12.2% |
| Nepalese | 0.2 /100 | #264 | Tragic 12.2% |
| Immigrants | Portugal | 0.1 /100 | #265 | Tragic 12.3% |
| Hawaiians | 0.1 /100 | #266 | Tragic 12.3% |
| Immigrants | Germany | 0.1 /100 | #267 | Tragic 12.3% |
| Portuguese | 0.1 /100 | #268 | Tragic 12.3% |
| Czechoslovakians | 0.1 /100 | #269 | Tragic 12.3% |