Osage vs Croatian Male Disability
COMPARE
Osage
Croatian
Male Disability
Male Disability Comparison
Osage
Croatians
14.0%
MALE DISABILITY
0.0/ 100
METRIC RATING
323rd/ 347
METRIC RANK
11.8%
MALE DISABILITY
2.1/ 100
METRIC RATING
230th/ 347
METRIC RANK
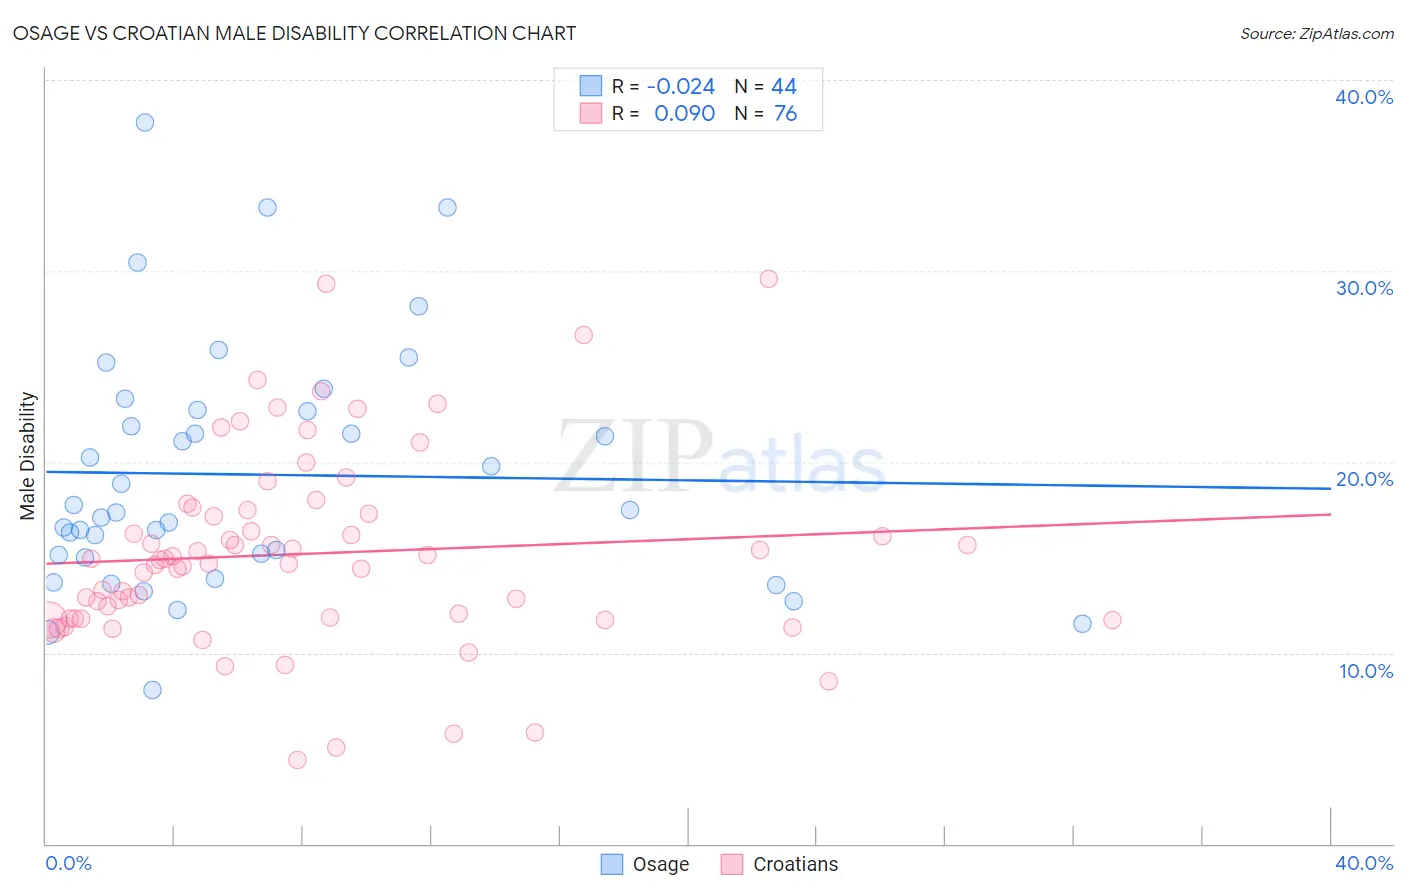
Osage vs Croatian Male Disability Correlation Chart
The statistical analysis conducted on geographies consisting of 91,798,879 people shows no correlation between the proportion of Osage and percentage of males with a disability in the United States with a correlation coefficient (R) of -0.024 and weighted average of 14.0%. Similarly, the statistical analysis conducted on geographies consisting of 375,704,968 people shows a slight positive correlation between the proportion of Croatians and percentage of males with a disability in the United States with a correlation coefficient (R) of 0.090 and weighted average of 11.8%, a difference of 18.6%.
Male Disability Correlation Summary
| Measurement | Osage | Croatian |
| Minimum | 8.0% | 4.4% |
| Maximum | 37.7% | 29.6% |
| Range | 29.7% | 25.2% |
| Mean | 19.3% | 15.2% |
| Median | 17.4% | 14.8% |
| Interquartile 25% (IQ1) | 15.1% | 11.8% |
| Interquartile 75% (IQ3) | 22.7% | 17.4% |
| Interquartile Range (IQR) | 7.6% | 5.6% |
| Standard Deviation (Sample) | 6.4% | 5.0% |
| Standard Deviation (Population) | 6.4% | 5.0% |
Similar Demographics by Male Disability
Demographics Similar to Osage by Male Disability
In terms of male disability, the demographic groups most similar to Osage are Apache (14.0%, a difference of 0.070%), Comanche (14.1%, a difference of 0.33%), Ottawa (14.1%, a difference of 0.44%), Shoshone (13.8%, a difference of 1.2%), and Tlingit-Haida (13.8%, a difference of 1.3%).
| Demographics | Rating | Rank | Male Disability |
| Alaska Natives | 0.0 /100 | #316 | Tragic 13.6% |
| Paiute | 0.0 /100 | #317 | Tragic 13.7% |
| Cree | 0.0 /100 | #318 | Tragic 13.7% |
| Americans | 0.0 /100 | #319 | Tragic 13.8% |
| Tlingit-Haida | 0.0 /100 | #320 | Tragic 13.8% |
| Shoshone | 0.0 /100 | #321 | Tragic 13.8% |
| Apache | 0.0 /100 | #322 | Tragic 14.0% |
| Osage | 0.0 /100 | #323 | Tragic 14.0% |
| Comanche | 0.0 /100 | #324 | Tragic 14.1% |
| Ottawa | 0.0 /100 | #325 | Tragic 14.1% |
| Natives/Alaskans | 0.0 /100 | #326 | Tragic 14.2% |
| Potawatomi | 0.0 /100 | #327 | Tragic 14.2% |
| Chippewa | 0.0 /100 | #328 | Tragic 14.3% |
| Cajuns | 0.0 /100 | #329 | Tragic 14.4% |
| Navajo | 0.0 /100 | #330 | Tragic 14.4% |
Demographics Similar to Croatians by Male Disability
In terms of male disability, the demographic groups most similar to Croatians are Bermudan (11.8%, a difference of 0.090%), Hispanic or Latino (11.8%, a difference of 0.12%), Austrian (11.8%, a difference of 0.20%), Dominican (11.8%, a difference of 0.20%), and Malaysian (11.8%, a difference of 0.26%).
| Demographics | Rating | Rank | Male Disability |
| Immigrants | Bahamas | 3.2 /100 | #223 | Tragic 11.7% |
| Japanese | 3.1 /100 | #224 | Tragic 11.7% |
| Liberians | 3.1 /100 | #225 | Tragic 11.8% |
| Sub-Saharan Africans | 2.8 /100 | #226 | Tragic 11.8% |
| Austrians | 2.5 /100 | #227 | Tragic 11.8% |
| Hispanics or Latinos | 2.3 /100 | #228 | Tragic 11.8% |
| Bermudans | 2.3 /100 | #229 | Tragic 11.8% |
| Croatians | 2.1 /100 | #230 | Tragic 11.8% |
| Dominicans | 1.8 /100 | #231 | Tragic 11.8% |
| Malaysians | 1.8 /100 | #232 | Tragic 11.8% |
| Mexicans | 1.7 /100 | #233 | Tragic 11.8% |
| Immigrants | Canada | 1.6 /100 | #234 | Tragic 11.9% |
| Immigrants | North America | 1.5 /100 | #235 | Tragic 11.9% |
| U.S. Virgin Islanders | 1.3 /100 | #236 | Tragic 11.9% |
| Carpatho Rusyns | 1.3 /100 | #237 | Tragic 11.9% |