Armenian vs Immigrants from Somalia Male Disability

COMPARE

Armenian
Race
Ancestry
AfghanAfricanAlaska NativeAlaskan AthabascanAlbanianAleutAlsatianAmericanApacheArabArapahoArgentineanArmenianAssyrian/Chaldean/SyriacAustralianAustrianBahamianBangladeshiBarbadianBasqueBelgianBelizeanBermudanBhutaneseBlackfeetBolivianBrazilianBritishBritish West IndianBulgarianBurmeseCajunCambodianCanadianCape VerdeanCarpatho RusynCelticCentral AmericanCentral American IndianCherokeeCheyenneChickasawChileanChineseChippewaChoctawColombianColvilleComancheCosta RicanCreeCreekCroatianCrowCubanCypriotCzechCzechoslovakianDanishDelawareDominicanDutchDutch West IndianEastern EuropeanEcuadorianEgyptianEnglishEstonianEthiopianEuropeanFijianFilipinoFinnishFrenchFrench American IndianFrench CanadianGermanGerman RussianGhanaianGreekGuamanian/ChamorroGuatemalanGuyaneseHaitianHmongHonduranHopiHoumaHungarianIcelanderIndian (Asian)IndonesianInupiatIranianIraqiIrishIroquoisIsraeliItalianJamaicanJapaneseJordanianKenyanKiowaKoreanLaotianLatvianLebaneseLiberianLithuanianLumbeeLuxembourgerMacedonianMalaysianMalteseMarshalleseMenomineeMexicanMexican American IndianMongolianMoroccanNative HawaiianNavajoNepaleseNew ZealanderNicaraguanNigerianNorthern EuropeanNorwegianOkinawanOsageOttawaPaiutePakistaniPalestinianPanamanianParaguayanPennsylvania GermanPeruvianPimaPolishPortuguesePotawatomiPuebloPuerto RicanPuget Sound SalishRomanianRussianSalvadoranSamoanScandinavianScotch-IrishScottishSeminoleSenegaleseSerbianShoshoneSierra LeoneanSiouxSlavicSlovakSloveneSomaliSouth AfricanSouth AmericanSouth American IndianSoviet UnionSpaniardSpanishSpanish AmericanSpanish American IndianSri LankanSubsaharan AfricanSudaneseSwedishSwissSyrianTaiwaneseThaiTlingit-HaidaTohono O'OdhamTonganTrinidadian and TobagonianTsimshianTurkishU.S. Virgin IslanderUgandanUkrainianUruguayanUteVenezuelanVietnameseWelshWest IndianYakamaYaquiYugoslavianYumanYup'ikZimbabwean
Immigration
NonimmigrantsImmigrantsAfghanistanAfricaAlbaniaArgentinaArmeniaAsiaAustraliaAustriaBahamasBangladeshBarbadosBelarusBelgiumBelizeBoliviaBosnia and HerzegovinaBrazilBulgariaBurma/MyanmarCabo VerdeCambodiaCameroonCanadaCaribbeanCentral AmericaChileChinaColombiaCongoCosta RicaCroatiaCubaCzechoslovakiaDenmarkDominicaDominican RepublicEastern AfricaEastern AsiaEastern EuropeEcuadorEgyptEl SalvadorEnglandEritreaEthiopiaEuropeFijiFranceGermanyGhanaGreeceGrenadaGuatemalaGuyanaHaitiHondurasHong KongHungaryIndiaIndonesiaIranIraqIrelandIsraelItalyJamaicaJapanJordanKazakhstanKenyaKoreaKuwaitLaosLatin AmericaLatviaLebanonLiberiaLithuaniaMalaysiaMexicoMicronesiaMiddle AfricaMoldovaMoroccoNepalNetherlandsNicaraguaNigeriaNorth AmericaNorth MacedoniaNorthern AfricaNorthern EuropeNorwayOceaniaPakistanPanamaPeruPhilippinesPolandPortugalRomaniaRussiaSaudi ArabiaScotlandSenegalSerbiaSierra LeoneSingaporeSouth AfricaSouth AmericaSouth Central AsiaSouth Eastern AsiaSouthern EuropeSpainSri LankaSt. Vincent and the GrenadinesSudanSwedenSwitzerlandSyriaTaiwanThailandTrinidad and TobagoTurkeyUgandaUkraineUruguayUzbekistanVenezuelaVietnamWest IndiesWestern AfricaWestern AsiaWestern EuropeYemenZaireZimbabweAzores
Immigrants from Somalia
Race
Ancestry
AfghanAfricanAlaska NativeAlaskan AthabascanAlbanianAleutAlsatianAmericanApacheArabArapahoArgentineanAssyrian/Chaldean/SyriacAustralianAustrianBahamianBangladeshiBarbadianBasqueBelgianBelizeanBermudanBhutaneseBlackfeetBolivianBrazilianBritishBritish West IndianBulgarianBurmeseCajunCambodianCanadianCape VerdeanCarpatho RusynCelticCentral AmericanCentral American IndianCherokeeCheyenneChickasawChileanChineseChippewaChoctawColombianColvilleComancheCosta RicanCreeCreekCroatianCrowCubanCypriotCzechCzechoslovakianDanishDelawareDominicanDutchDutch West IndianEastern EuropeanEcuadorianEgyptianEnglishEstonianEthiopianEuropeanFijianFilipinoFinnishFrenchFrench American IndianFrench CanadianGermanGerman RussianGhanaianGreekGuamanian/ChamorroGuatemalanGuyaneseHaitianHmongHonduranHopiHoumaHungarianIcelanderIndian (Asian)IndonesianInupiatIranianIraqiIrishIroquoisIsraeliItalianJamaicanJapaneseJordanianKenyanKiowaKoreanLaotianLatvianLebaneseLiberianLithuanianLumbeeLuxembourgerMacedonianMalaysianMalteseMarshalleseMenomineeMexicanMexican American IndianMongolianMoroccanNative HawaiianNavajoNepaleseNew ZealanderNicaraguanNigerianNorthern EuropeanNorwegianOkinawanOsageOttawaPaiutePakistaniPalestinianPanamanianParaguayanPennsylvania GermanPeruvianPimaPolishPortuguesePotawatomiPuebloPuerto RicanPuget Sound SalishRomanianRussianSalvadoranSamoanScandinavianScotch-IrishScottishSeminoleSenegaleseSerbianShoshoneSierra LeoneanSiouxSlavicSlovakSloveneSomaliSouth AfricanSouth AmericanSouth American IndianSoviet UnionSpaniardSpanishSpanish AmericanSpanish American IndianSri LankanSubsaharan AfricanSudaneseSwedishSwissSyrianTaiwaneseThaiTlingit-HaidaTohono O'OdhamTonganTrinidadian and TobagonianTsimshianTurkishU.S. Virgin IslanderUgandanUkrainianUruguayanUteVenezuelanVietnameseWelshWest IndianYakamaYaquiYugoslavianYumanYup'ikZimbabwean
Immigration
NonimmigrantsImmigrantsAfghanistanAfricaAlbaniaArgentinaArmeniaAsiaAustraliaAustriaBahamasBangladeshBarbadosBelarusBelgiumBelizeBoliviaBosnia and HerzegovinaBrazilBulgariaBurma/MyanmarCabo VerdeCambodiaCameroonCanadaCaribbeanCentral AmericaChileChinaColombiaCongoCosta RicaCroatiaCubaCzechoslovakiaDenmarkDominicaDominican RepublicEastern AfricaEastern AsiaEastern EuropeEcuadorEgyptEl SalvadorEnglandEritreaEthiopiaEuropeFijiFranceGermanyGhanaGreeceGrenadaGuatemalaGuyanaHaitiHondurasHong KongHungaryIndiaIndonesiaIranIraqIrelandIsraelItalyJamaicaJapanJordanKazakhstanKenyaKoreaKuwaitLaosLatin AmericaLatviaLebanonLiberiaLithuaniaMalaysiaMexicoMicronesiaMiddle AfricaMoldovaMoroccoNepalNetherlandsNicaraguaNigeriaNorth AmericaNorth MacedoniaNorthern AfricaNorthern EuropeNorwayOceaniaPakistanPanamaPeruPhilippinesPolandPortugalRomaniaRussiaSaudi ArabiaScotlandSenegalSerbiaSierra LeoneSingaporeSomaliaSouth AfricaSouth AmericaSouth Central AsiaSouth Eastern AsiaSouthern EuropeSpainSri LankaSt. Vincent and the GrenadinesSudanSwedenSwitzerlandSyriaTaiwanThailandTrinidad and TobagoTurkeyUgandaUkraineUruguayUzbekistanVenezuelaVietnamWest IndiesWestern AfricaWestern AsiaWestern EuropeYemenZaireZimbabweAzores
Male Disability
Income
Poverty
Unemployment
Labor Participation
Family Structure
Vehicle Availability
Education Level
Disability

Male Disability Comparison

Armenians

Immigrants from Somalia

Exceptional
Poor
10.9%
MALE DISABILITY
90.1/ 100
METRIC RATING
119th/ 347
METRIC RANK
11.5%
MALE DISABILITY
10.4/ 100
METRIC RATING
207th/ 347
METRIC RANK

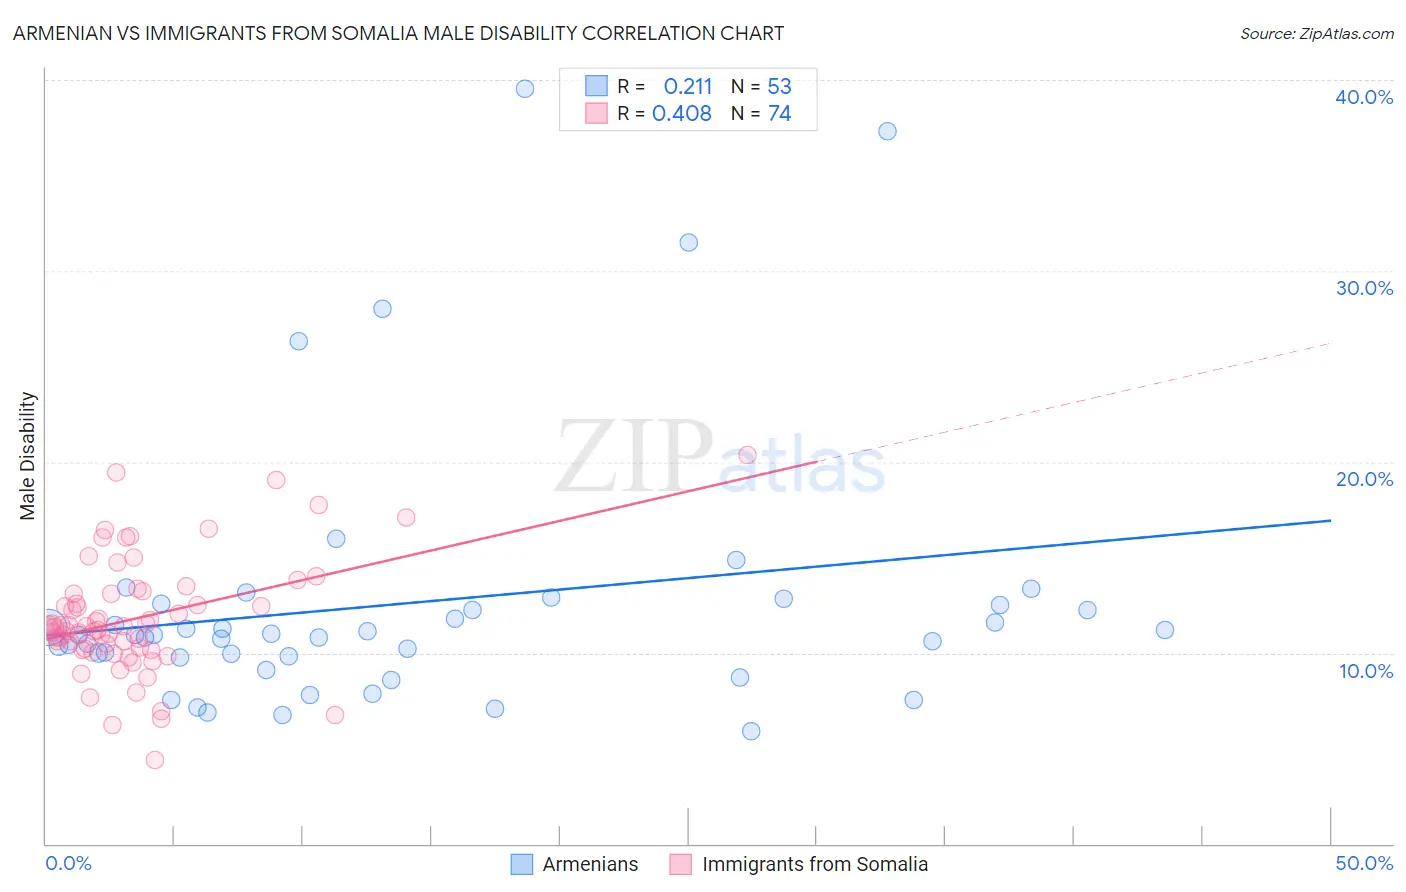
Armenian vs Immigrants from Somalia Male Disability Correlation Chart

The statistical analysis conducted on geographies consisting of 310,935,908 people shows a weak positive correlation between the proportion of Armenians and percentage of males with a disability in the United States with a correlation coefficient (R) of 0.211 and weighted average of 10.9%. Similarly, the statistical analysis conducted on geographies consisting of 92,107,608 people shows a moderate positive correlation between the proportion of Immigrants from Somalia and percentage of males with a disability in the United States with a correlation coefficient (R) of 0.408 and weighted average of 11.5%, a difference of 6.2%.
Armenian vs Immigrants from Somalia Male Disability

Male Disability Correlation Summary

MeasurementArmenianImmigrants from Somalia
Minimum5.9%4.4%
Maximum39.5%20.4%
Range33.7%16.0%
Mean12.6%11.8%
Median10.9%11.4%
Interquartile 25% (IQ1)9.8%10.2%
Interquartile 75% (IQ3)12.5%13.1%
Interquartile Range (IQR)2.8%2.9%
Standard Deviation (Sample)7.0%3.0%
Standard Deviation (Population)6.9%3.0%

Similar Demographics by Male Disability

Demographics Similar to Armenians by Male Disability

In terms of male disability, the demographic groups most similar to Armenians are Immigrants from Cuba (10.9%, a difference of 0.0%), Eastern European (10.9%, a difference of 0.080%), Immigrants from Africa (10.9%, a difference of 0.11%), Immigrants from South Eastern Asia (10.9%, a difference of 0.15%), and Immigrants from Ghana (10.9%, a difference of 0.17%).
DemographicsRating | RankMale Disability
Ghanaians
93.4
/100
|
#112
Exceptional
10.8%
Immigrants | Zimbabwe
93.0
/100
|
#113
Exceptional
10.8%
Central Americans
92.7
/100
|
#114
Exceptional
10.8%
Immigrants | Barbados
92.2
/100
|
#115
Exceptional
10.8%
Immigrants | South Africa
91.8
/100
|
#116
Exceptional
10.8%
Eastern Europeans
90.6
/100
|
#117
Exceptional
10.9%
Immigrants | Cuba
90.2
/100
|
#118
Exceptional
10.9%
Armenians
90.1
/100
|
#119
Exceptional
10.9%
Immigrants | Africa
89.4
/100
|
#120
Excellent
10.9%
Immigrants | South Eastern Asia
89.2
/100
|
#121
Excellent
10.9%
Immigrants | Ghana
89.0
/100
|
#122
Excellent
10.9%
Immigrants | Czechoslovakia
88.4
/100
|
#123
Excellent
10.9%
South American Indians
88.1
/100
|
#124
Excellent
10.9%
Immigrants | North Macedonia
88.1
/100
|
#125
Excellent
10.9%
Immigrants | Trinidad and Tobago
86.9
/100
|
#126
Excellent
10.9%

Demographics Similar to Immigrants from Somalia by Male Disability

In terms of male disability, the demographic groups most similar to Immigrants from Somalia are Ukrainian (11.5%, a difference of 0.030%), Serbian (11.5%, a difference of 0.040%), Icelander (11.6%, a difference of 0.040%), Immigrants from Cambodia (11.5%, a difference of 0.050%), and Spanish American Indian (11.6%, a difference of 0.050%).
DemographicsRating | RankMale Disability
Immigrants | Iraq
13.0
/100
|
#200
Poor
11.5%
Immigrants | Panama
13.0
/100
|
#201
Poor
11.5%
Immigrants | Mexico
12.6
/100
|
#202
Poor
11.5%
Jamaicans
10.9
/100
|
#203
Poor
11.5%
Immigrants | Cambodia
10.8
/100
|
#204
Poor
11.5%
Serbians
10.7
/100
|
#205
Poor
11.5%
Ukrainians
10.6
/100
|
#206
Poor
11.5%
Immigrants | Somalia
10.4
/100
|
#207
Poor
11.5%
Icelanders
10.1
/100
|
#208
Poor
11.6%
Spanish American Indians
10.1
/100
|
#209
Poor
11.6%
Ute
9.4
/100
|
#210
Tragic
11.6%
Immigrants | Thailand
8.4
/100
|
#211
Tragic
11.6%
Immigrants | Scotland
8.2
/100
|
#212
Tragic
11.6%
Mexican American Indians
7.8
/100
|
#213
Tragic
11.6%
Lithuanians
6.6
/100
|
#214
Tragic
11.6%