Osage vs German Russian Male Disability
COMPARE
Osage
German Russian
Male Disability
Male Disability Comparison
Osage
German Russians
14.0%
MALE DISABILITY
0.0/ 100
METRIC RATING
323rd/ 347
METRIC RANK
12.0%
MALE DISABILITY
0.5/ 100
METRIC RATING
251st/ 347
METRIC RANK
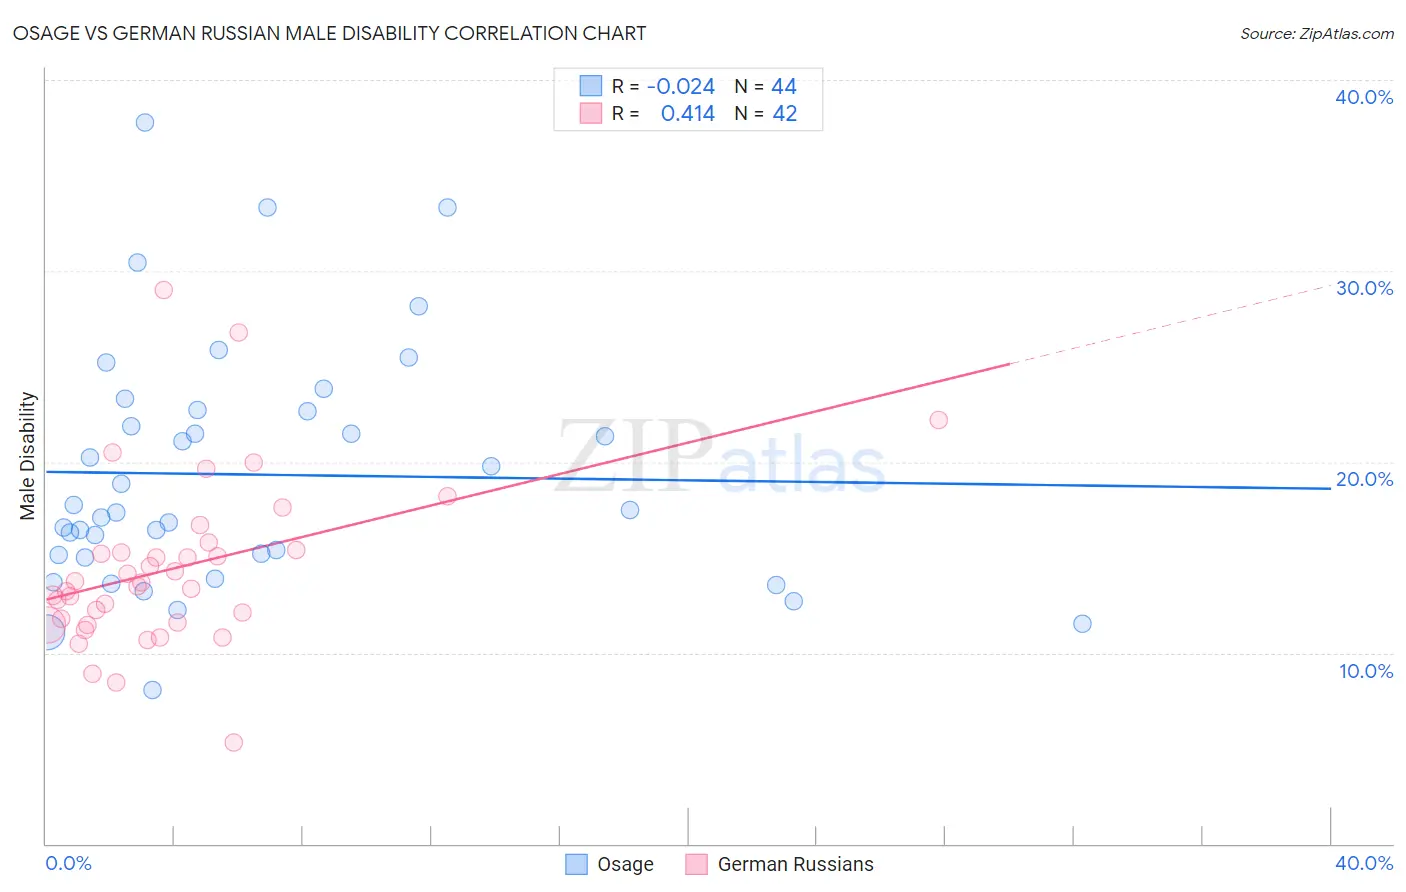
Osage vs German Russian Male Disability Correlation Chart
The statistical analysis conducted on geographies consisting of 91,798,879 people shows no correlation between the proportion of Osage and percentage of males with a disability in the United States with a correlation coefficient (R) of -0.024 and weighted average of 14.0%. Similarly, the statistical analysis conducted on geographies consisting of 96,458,633 people shows a moderate positive correlation between the proportion of German Russians and percentage of males with a disability in the United States with a correlation coefficient (R) of 0.414 and weighted average of 12.0%, a difference of 16.4%.
Male Disability Correlation Summary
| Measurement | Osage | German Russian |
| Minimum | 8.0% | 5.3% |
| Maximum | 37.7% | 29.0% |
| Range | 29.7% | 23.7% |
| Mean | 19.3% | 14.4% |
| Median | 17.4% | 13.6% |
| Interquartile 25% (IQ1) | 15.1% | 11.6% |
| Interquartile 75% (IQ3) | 22.7% | 15.4% |
| Interquartile Range (IQR) | 7.6% | 3.8% |
| Standard Deviation (Sample) | 6.4% | 4.5% |
| Standard Deviation (Population) | 6.4% | 4.4% |
Similar Demographics by Male Disability
Demographics Similar to Osage by Male Disability
In terms of male disability, the demographic groups most similar to Osage are Apache (14.0%, a difference of 0.070%), Comanche (14.1%, a difference of 0.33%), Ottawa (14.1%, a difference of 0.44%), Shoshone (13.8%, a difference of 1.2%), and Tlingit-Haida (13.8%, a difference of 1.3%).
| Demographics | Rating | Rank | Male Disability |
| Alaska Natives | 0.0 /100 | #316 | Tragic 13.6% |
| Paiute | 0.0 /100 | #317 | Tragic 13.7% |
| Cree | 0.0 /100 | #318 | Tragic 13.7% |
| Americans | 0.0 /100 | #319 | Tragic 13.8% |
| Tlingit-Haida | 0.0 /100 | #320 | Tragic 13.8% |
| Shoshone | 0.0 /100 | #321 | Tragic 13.8% |
| Apache | 0.0 /100 | #322 | Tragic 14.0% |
| Osage | 0.0 /100 | #323 | Tragic 14.0% |
| Comanche | 0.0 /100 | #324 | Tragic 14.1% |
| Ottawa | 0.0 /100 | #325 | Tragic 14.1% |
| Natives/Alaskans | 0.0 /100 | #326 | Tragic 14.2% |
| Potawatomi | 0.0 /100 | #327 | Tragic 14.2% |
| Chippewa | 0.0 /100 | #328 | Tragic 14.3% |
| Cajuns | 0.0 /100 | #329 | Tragic 14.4% |
| Navajo | 0.0 /100 | #330 | Tragic 14.4% |
Demographics Similar to German Russians by Male Disability
In terms of male disability, the demographic groups most similar to German Russians are Bangladeshi (12.0%, a difference of 0.010%), Immigrants from Yemen (12.0%, a difference of 0.060%), Slovene (12.0%, a difference of 0.070%), Guamanian/Chamorro (12.0%, a difference of 0.070%), and British (12.1%, a difference of 0.26%).
| Demographics | Rating | Rank | Male Disability |
| Immigrants | Laos | 1.0 /100 | #244 | Tragic 11.9% |
| Immigrants | Liberia | 1.0 /100 | #245 | Tragic 11.9% |
| Danes | 0.9 /100 | #246 | Tragic 11.9% |
| Hungarians | 0.8 /100 | #247 | Tragic 12.0% |
| Poles | 0.7 /100 | #248 | Tragic 12.0% |
| Immigrants | Yemen | 0.5 /100 | #249 | Tragic 12.0% |
| Bangladeshis | 0.5 /100 | #250 | Tragic 12.0% |
| German Russians | 0.5 /100 | #251 | Tragic 12.0% |
| Slovenes | 0.5 /100 | #252 | Tragic 12.0% |
| Guamanians/Chamorros | 0.5 /100 | #253 | Tragic 12.0% |
| British | 0.4 /100 | #254 | Tragic 12.1% |
| Chinese | 0.4 /100 | #255 | Tragic 12.1% |
| Swiss | 0.3 /100 | #256 | Tragic 12.1% |
| Europeans | 0.3 /100 | #257 | Tragic 12.1% |
| Basques | 0.3 /100 | #258 | Tragic 12.1% |