Osage vs Immigrants from China Male Disability
COMPARE
Osage
Immigrants from China
Male Disability
Male Disability Comparison
Osage
Immigrants from China
14.0%
MALE DISABILITY
0.0/ 100
METRIC RATING
323rd/ 347
METRIC RANK
9.5%
MALE DISABILITY
100.0/ 100
METRIC RATING
8th/ 347
METRIC RANK
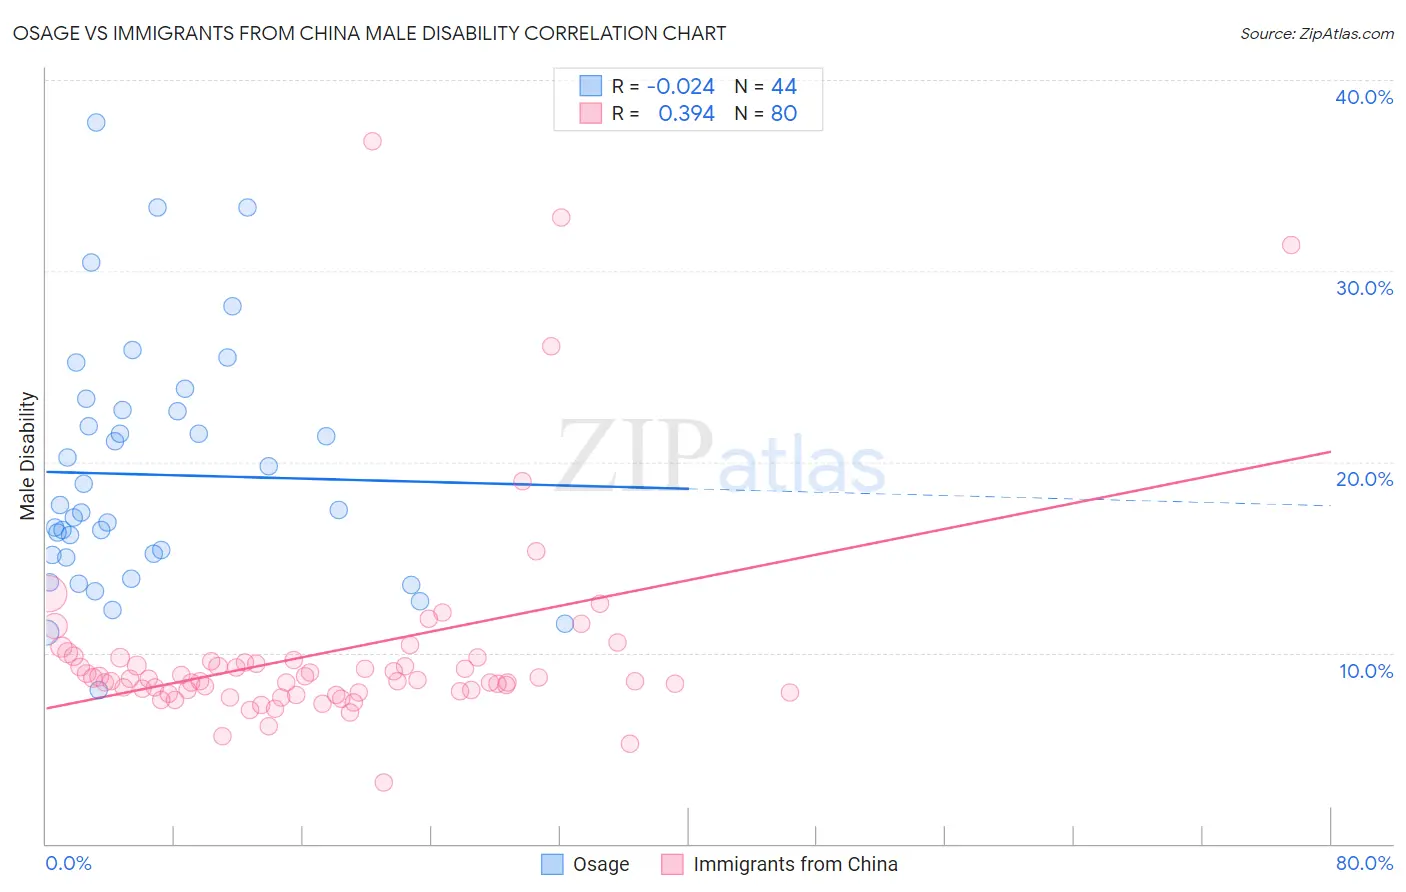
Osage vs Immigrants from China Male Disability Correlation Chart
The statistical analysis conducted on geographies consisting of 91,798,879 people shows no correlation between the proportion of Osage and percentage of males with a disability in the United States with a correlation coefficient (R) of -0.024 and weighted average of 14.0%. Similarly, the statistical analysis conducted on geographies consisting of 457,000,034 people shows a mild positive correlation between the proportion of Immigrants from China and percentage of males with a disability in the United States with a correlation coefficient (R) of 0.394 and weighted average of 9.5%, a difference of 47.2%.
Male Disability Correlation Summary
| Measurement | Osage | Immigrants from China |
| Minimum | 8.0% | 3.2% |
| Maximum | 37.7% | 36.8% |
| Range | 29.7% | 33.5% |
| Mean | 19.3% | 10.0% |
| Median | 17.4% | 8.6% |
| Interquartile 25% (IQ1) | 15.1% | 8.0% |
| Interquartile 75% (IQ3) | 22.7% | 9.6% |
| Interquartile Range (IQR) | 7.6% | 1.6% |
| Standard Deviation (Sample) | 6.4% | 5.5% |
| Standard Deviation (Population) | 6.4% | 5.4% |
Similar Demographics by Male Disability
Demographics Similar to Osage by Male Disability
In terms of male disability, the demographic groups most similar to Osage are Apache (14.0%, a difference of 0.070%), Comanche (14.1%, a difference of 0.33%), Ottawa (14.1%, a difference of 0.44%), Shoshone (13.8%, a difference of 1.2%), and Tlingit-Haida (13.8%, a difference of 1.3%).
| Demographics | Rating | Rank | Male Disability |
| Alaska Natives | 0.0 /100 | #316 | Tragic 13.6% |
| Paiute | 0.0 /100 | #317 | Tragic 13.7% |
| Cree | 0.0 /100 | #318 | Tragic 13.7% |
| Americans | 0.0 /100 | #319 | Tragic 13.8% |
| Tlingit-Haida | 0.0 /100 | #320 | Tragic 13.8% |
| Shoshone | 0.0 /100 | #321 | Tragic 13.8% |
| Apache | 0.0 /100 | #322 | Tragic 14.0% |
| Osage | 0.0 /100 | #323 | Tragic 14.0% |
| Comanche | 0.0 /100 | #324 | Tragic 14.1% |
| Ottawa | 0.0 /100 | #325 | Tragic 14.1% |
| Natives/Alaskans | 0.0 /100 | #326 | Tragic 14.2% |
| Potawatomi | 0.0 /100 | #327 | Tragic 14.2% |
| Chippewa | 0.0 /100 | #328 | Tragic 14.3% |
| Cajuns | 0.0 /100 | #329 | Tragic 14.4% |
| Navajo | 0.0 /100 | #330 | Tragic 14.4% |
Demographics Similar to Immigrants from China by Male Disability
In terms of male disability, the demographic groups most similar to Immigrants from China are Immigrants from Singapore (9.5%, a difference of 0.080%), Immigrants from Israel (9.6%, a difference of 0.51%), Immigrants from Bolivia (9.5%, a difference of 0.60%), Immigrants from South Central Asia (9.4%, a difference of 0.93%), and Immigrants from Hong Kong (9.4%, a difference of 0.99%).
| Demographics | Rating | Rank | Male Disability |
| Immigrants | India | 100.0 /100 | #1 | Exceptional 9.0% |
| Immigrants | Taiwan | 100.0 /100 | #2 | Exceptional 9.1% |
| Filipinos | 100.0 /100 | #3 | Exceptional 9.1% |
| Thais | 100.0 /100 | #4 | Exceptional 9.2% |
| Immigrants | Hong Kong | 100.0 /100 | #5 | Exceptional 9.4% |
| Immigrants | South Central Asia | 100.0 /100 | #6 | Exceptional 9.4% |
| Immigrants | Bolivia | 100.0 /100 | #7 | Exceptional 9.5% |
| Immigrants | China | 100.0 /100 | #8 | Exceptional 9.5% |
| Immigrants | Singapore | 100.0 /100 | #9 | Exceptional 9.5% |
| Immigrants | Israel | 100.0 /100 | #10 | Exceptional 9.6% |
| Immigrants | Eastern Asia | 100.0 /100 | #11 | Exceptional 9.6% |
| Bolivians | 100.0 /100 | #12 | Exceptional 9.6% |
| Iranians | 100.0 /100 | #13 | Exceptional 9.7% |
| Immigrants | Iran | 100.0 /100 | #14 | Exceptional 9.7% |
| Indians (Asian) | 100.0 /100 | #15 | Exceptional 9.7% |