Osage vs Chilean Male Disability
COMPARE
Osage
Chilean
Male Disability
Male Disability Comparison
Osage
Chileans
14.0%
MALE DISABILITY
0.0/ 100
METRIC RATING
323rd/ 347
METRIC RANK
10.7%
MALE DISABILITY
96.9/ 100
METRIC RATING
95th/ 347
METRIC RANK
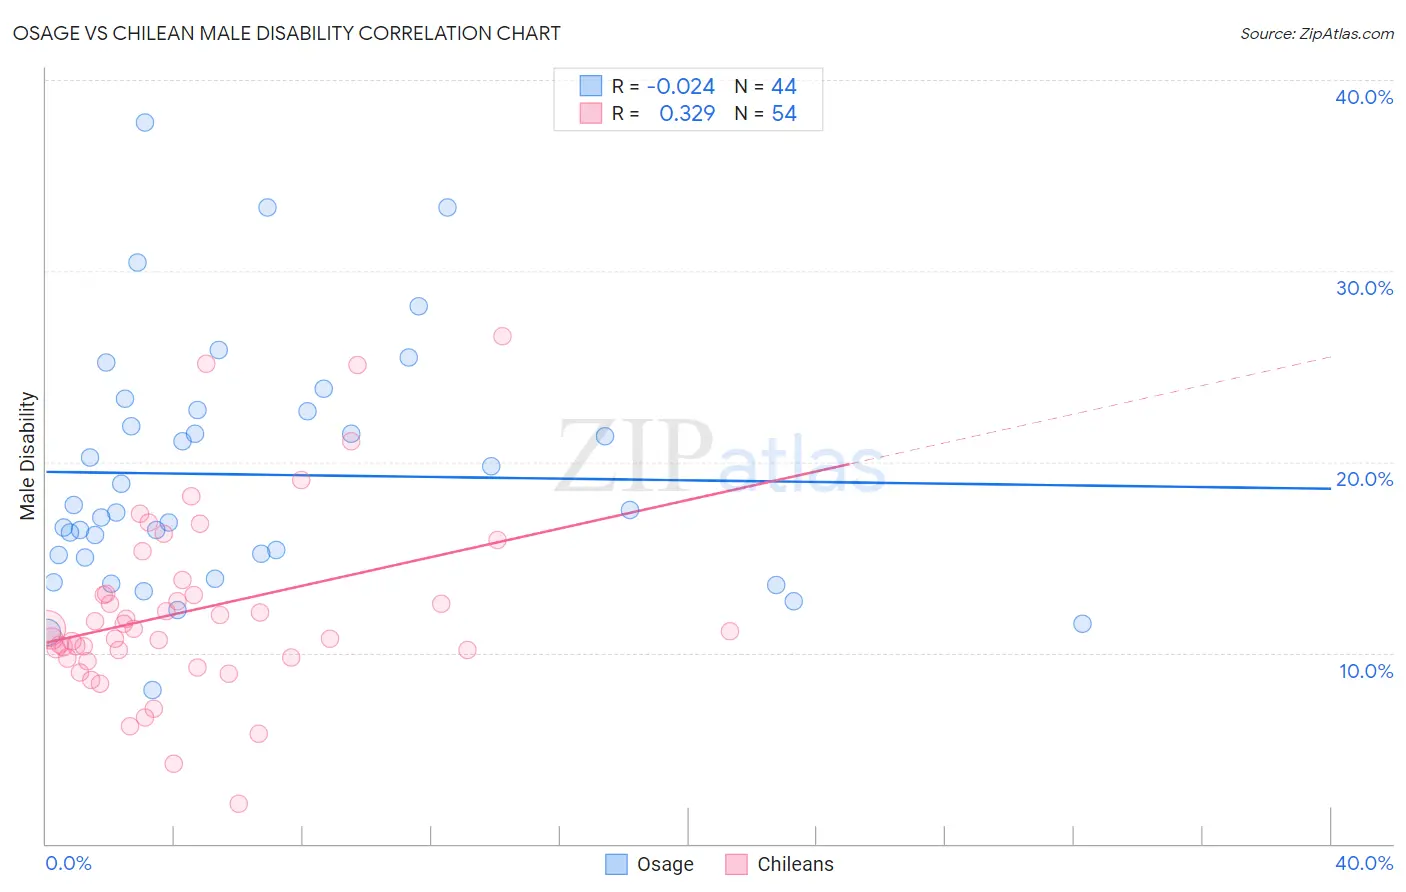
Osage vs Chilean Male Disability Correlation Chart
The statistical analysis conducted on geographies consisting of 91,798,879 people shows no correlation between the proportion of Osage and percentage of males with a disability in the United States with a correlation coefficient (R) of -0.024 and weighted average of 14.0%. Similarly, the statistical analysis conducted on geographies consisting of 256,663,212 people shows a mild positive correlation between the proportion of Chileans and percentage of males with a disability in the United States with a correlation coefficient (R) of 0.329 and weighted average of 10.7%, a difference of 31.1%.
Male Disability Correlation Summary
| Measurement | Osage | Chilean |
| Minimum | 8.0% | 2.1% |
| Maximum | 37.7% | 26.6% |
| Range | 29.7% | 24.5% |
| Mean | 19.3% | 12.2% |
| Median | 17.4% | 11.2% |
| Interquartile 25% (IQ1) | 15.1% | 9.8% |
| Interquartile 75% (IQ3) | 22.7% | 13.1% |
| Interquartile Range (IQR) | 7.6% | 3.3% |
| Standard Deviation (Sample) | 6.4% | 4.8% |
| Standard Deviation (Population) | 6.4% | 4.8% |
Similar Demographics by Male Disability
Demographics Similar to Osage by Male Disability
In terms of male disability, the demographic groups most similar to Osage are Apache (14.0%, a difference of 0.070%), Comanche (14.1%, a difference of 0.33%), Ottawa (14.1%, a difference of 0.44%), Shoshone (13.8%, a difference of 1.2%), and Tlingit-Haida (13.8%, a difference of 1.3%).
| Demographics | Rating | Rank | Male Disability |
| Alaska Natives | 0.0 /100 | #316 | Tragic 13.6% |
| Paiute | 0.0 /100 | #317 | Tragic 13.7% |
| Cree | 0.0 /100 | #318 | Tragic 13.7% |
| Americans | 0.0 /100 | #319 | Tragic 13.8% |
| Tlingit-Haida | 0.0 /100 | #320 | Tragic 13.8% |
| Shoshone | 0.0 /100 | #321 | Tragic 13.8% |
| Apache | 0.0 /100 | #322 | Tragic 14.0% |
| Osage | 0.0 /100 | #323 | Tragic 14.0% |
| Comanche | 0.0 /100 | #324 | Tragic 14.1% |
| Ottawa | 0.0 /100 | #325 | Tragic 14.1% |
| Natives/Alaskans | 0.0 /100 | #326 | Tragic 14.2% |
| Potawatomi | 0.0 /100 | #327 | Tragic 14.2% |
| Chippewa | 0.0 /100 | #328 | Tragic 14.3% |
| Cajuns | 0.0 /100 | #329 | Tragic 14.4% |
| Navajo | 0.0 /100 | #330 | Tragic 14.4% |
Demographics Similar to Chileans by Male Disability
In terms of male disability, the demographic groups most similar to Chileans are Immigrants from Sweden (10.7%, a difference of 0.030%), Nicaraguan (10.7%, a difference of 0.10%), Immigrants from Armenia (10.7%, a difference of 0.12%), Immigrants from St. Vincent and the Grenadines (10.7%, a difference of 0.14%), and Immigrants from Romania (10.7%, a difference of 0.18%).
| Demographics | Rating | Rank | Male Disability |
| Immigrants | Western Asia | 97.8 /100 | #88 | Exceptional 10.6% |
| Immigrants | Nicaragua | 97.8 /100 | #89 | Exceptional 10.6% |
| Immigrants | Morocco | 97.7 /100 | #90 | Exceptional 10.6% |
| Immigrants | France | 97.6 /100 | #91 | Exceptional 10.6% |
| Palestinians | 97.4 /100 | #92 | Exceptional 10.7% |
| Immigrants | St. Vincent and the Grenadines | 97.1 /100 | #93 | Exceptional 10.7% |
| Immigrants | Sweden | 96.9 /100 | #94 | Exceptional 10.7% |
| Chileans | 96.9 /100 | #95 | Exceptional 10.7% |
| Nicaraguans | 96.6 /100 | #96 | Exceptional 10.7% |
| Immigrants | Armenia | 96.6 /100 | #97 | Exceptional 10.7% |
| Immigrants | Romania | 96.5 /100 | #98 | Exceptional 10.7% |
| Immigrants | Switzerland | 96.1 /100 | #99 | Exceptional 10.7% |
| Immigrants | Kazakhstan | 95.9 /100 | #100 | Exceptional 10.7% |
| Immigrants | Greece | 95.6 /100 | #101 | Exceptional 10.7% |
| Immigrants | Eastern Europe | 95.3 /100 | #102 | Exceptional 10.7% |