Immigrants from Singapore vs Immigrants from Somalia Male Disability
COMPARE
Immigrants from Singapore
Immigrants from Somalia
Male Disability
Male Disability Comparison
Immigrants from Singapore
Immigrants from Somalia
9.5%
MALE DISABILITY
100.0/ 100
METRIC RATING
9th/ 347
METRIC RANK
11.5%
MALE DISABILITY
10.4/ 100
METRIC RATING
207th/ 347
METRIC RANK
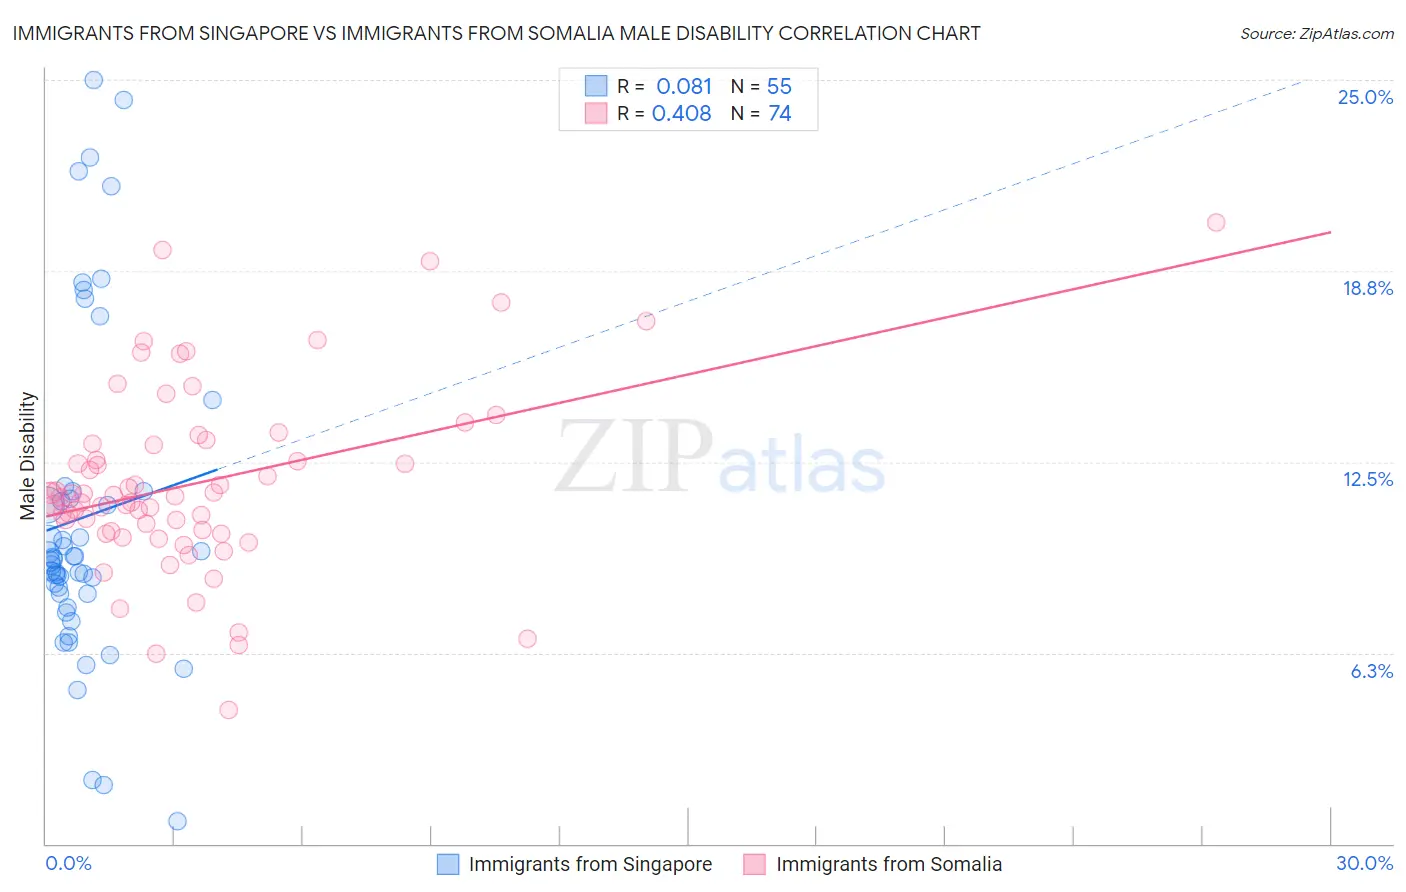
Immigrants from Singapore vs Immigrants from Somalia Male Disability Correlation Chart
The statistical analysis conducted on geographies consisting of 137,518,836 people shows a slight positive correlation between the proportion of Immigrants from Singapore and percentage of males with a disability in the United States with a correlation coefficient (R) of 0.081 and weighted average of 9.5%. Similarly, the statistical analysis conducted on geographies consisting of 92,107,608 people shows a moderate positive correlation between the proportion of Immigrants from Somalia and percentage of males with a disability in the United States with a correlation coefficient (R) of 0.408 and weighted average of 11.5%, a difference of 21.3%.
Male Disability Correlation Summary
| Measurement | Immigrants from Singapore | Immigrants from Somalia |
| Minimum | 0.75% | 4.4% |
| Maximum | 25.0% | 20.4% |
| Range | 24.2% | 16.0% |
| Mean | 10.7% | 11.8% |
| Median | 9.3% | 11.4% |
| Interquartile 25% (IQ1) | 8.2% | 10.2% |
| Interquartile 75% (IQ3) | 11.5% | 13.1% |
| Interquartile Range (IQR) | 3.4% | 2.9% |
| Standard Deviation (Sample) | 5.4% | 3.0% |
| Standard Deviation (Population) | 5.3% | 3.0% |
Similar Demographics by Male Disability
Demographics Similar to Immigrants from Singapore by Male Disability
In terms of male disability, the demographic groups most similar to Immigrants from Singapore are Immigrants from China (9.5%, a difference of 0.080%), Immigrants from Israel (9.6%, a difference of 0.43%), Immigrants from Bolivia (9.5%, a difference of 0.68%), Immigrants from Eastern Asia (9.6%, a difference of 0.98%), and Immigrants from South Central Asia (9.4%, a difference of 1.0%).
| Demographics | Rating | Rank | Male Disability |
| Immigrants | Taiwan | 100.0 /100 | #2 | Exceptional 9.1% |
| Filipinos | 100.0 /100 | #3 | Exceptional 9.1% |
| Thais | 100.0 /100 | #4 | Exceptional 9.2% |
| Immigrants | Hong Kong | 100.0 /100 | #5 | Exceptional 9.4% |
| Immigrants | South Central Asia | 100.0 /100 | #6 | Exceptional 9.4% |
| Immigrants | Bolivia | 100.0 /100 | #7 | Exceptional 9.5% |
| Immigrants | China | 100.0 /100 | #8 | Exceptional 9.5% |
| Immigrants | Singapore | 100.0 /100 | #9 | Exceptional 9.5% |
| Immigrants | Israel | 100.0 /100 | #10 | Exceptional 9.6% |
| Immigrants | Eastern Asia | 100.0 /100 | #11 | Exceptional 9.6% |
| Bolivians | 100.0 /100 | #12 | Exceptional 9.6% |
| Iranians | 100.0 /100 | #13 | Exceptional 9.7% |
| Immigrants | Iran | 100.0 /100 | #14 | Exceptional 9.7% |
| Indians (Asian) | 100.0 /100 | #15 | Exceptional 9.7% |
| Okinawans | 100.0 /100 | #16 | Exceptional 9.8% |
Demographics Similar to Immigrants from Somalia by Male Disability
In terms of male disability, the demographic groups most similar to Immigrants from Somalia are Ukrainian (11.5%, a difference of 0.030%), Serbian (11.5%, a difference of 0.040%), Icelander (11.6%, a difference of 0.040%), Immigrants from Cambodia (11.5%, a difference of 0.050%), and Spanish American Indian (11.6%, a difference of 0.050%).
| Demographics | Rating | Rank | Male Disability |
| Immigrants | Iraq | 13.0 /100 | #200 | Poor 11.5% |
| Immigrants | Panama | 13.0 /100 | #201 | Poor 11.5% |
| Immigrants | Mexico | 12.6 /100 | #202 | Poor 11.5% |
| Jamaicans | 10.9 /100 | #203 | Poor 11.5% |
| Immigrants | Cambodia | 10.8 /100 | #204 | Poor 11.5% |
| Serbians | 10.7 /100 | #205 | Poor 11.5% |
| Ukrainians | 10.6 /100 | #206 | Poor 11.5% |
| Immigrants | Somalia | 10.4 /100 | #207 | Poor 11.5% |
| Icelanders | 10.1 /100 | #208 | Poor 11.6% |
| Spanish American Indians | 10.1 /100 | #209 | Poor 11.6% |
| Ute | 9.4 /100 | #210 | Tragic 11.6% |
| Immigrants | Thailand | 8.4 /100 | #211 | Tragic 11.6% |
| Immigrants | Scotland | 8.2 /100 | #212 | Tragic 11.6% |
| Mexican American Indians | 7.8 /100 | #213 | Tragic 11.6% |
| Lithuanians | 6.6 /100 | #214 | Tragic 11.6% |