Venezuelan vs Immigrants from Somalia Male Disability
COMPARE
Venezuelan
Immigrants from Somalia
Male Disability
Male Disability Comparison
Venezuelans
Immigrants from Somalia
10.1%
MALE DISABILITY
99.9/ 100
METRIC RATING
29th/ 347
METRIC RANK
11.5%
MALE DISABILITY
10.4/ 100
METRIC RATING
207th/ 347
METRIC RANK
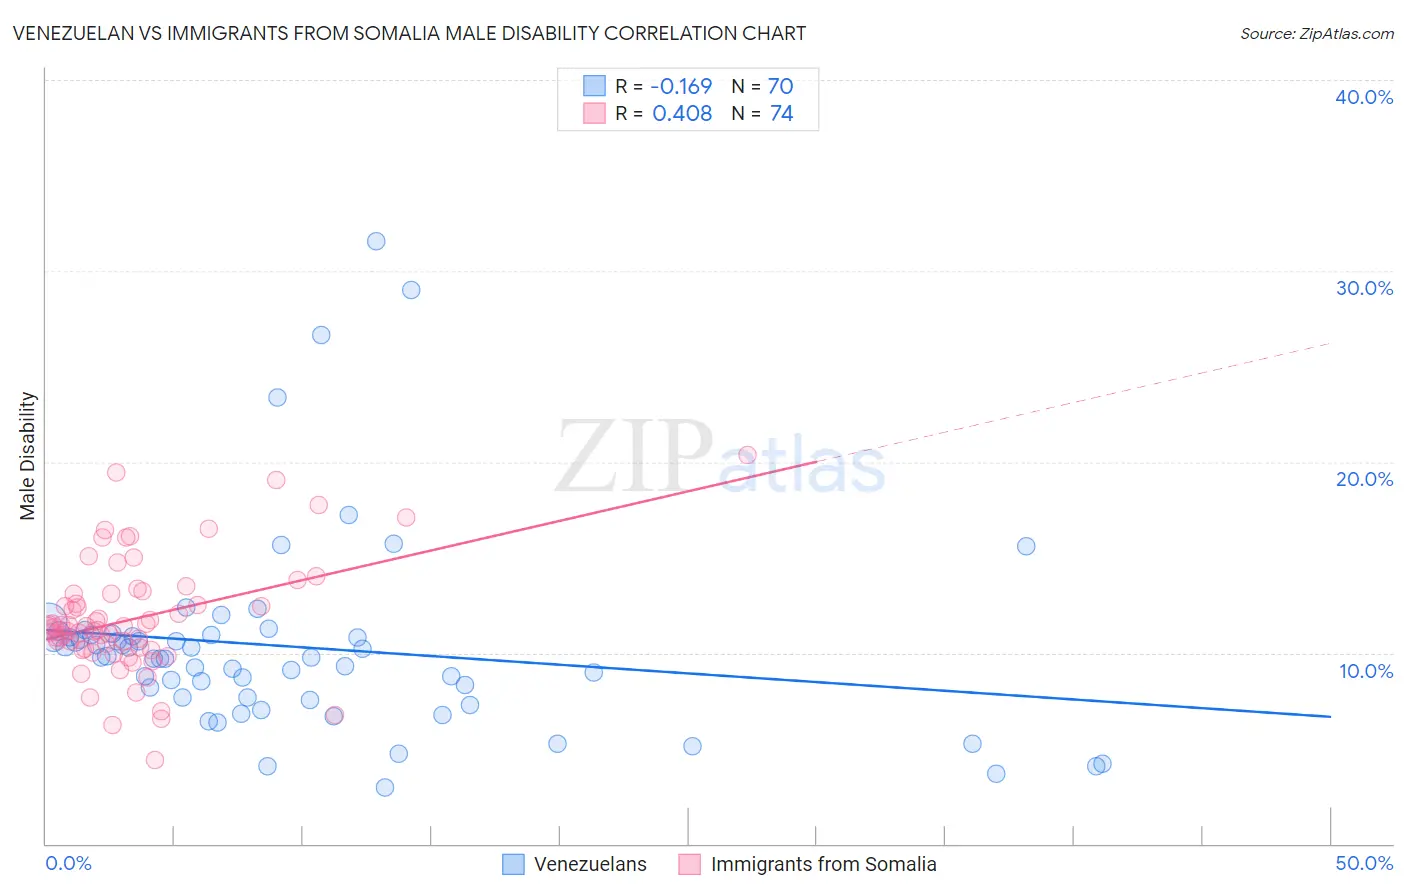
Venezuelan vs Immigrants from Somalia Male Disability Correlation Chart
The statistical analysis conducted on geographies consisting of 306,294,374 people shows a poor negative correlation between the proportion of Venezuelans and percentage of males with a disability in the United States with a correlation coefficient (R) of -0.169 and weighted average of 10.1%. Similarly, the statistical analysis conducted on geographies consisting of 92,107,608 people shows a moderate positive correlation between the proportion of Immigrants from Somalia and percentage of males with a disability in the United States with a correlation coefficient (R) of 0.408 and weighted average of 11.5%, a difference of 14.3%.
Male Disability Correlation Summary
| Measurement | Venezuelan | Immigrants from Somalia |
| Minimum | 2.9% | 4.4% |
| Maximum | 31.6% | 20.4% |
| Range | 28.7% | 16.0% |
| Mean | 10.3% | 11.8% |
| Median | 9.8% | 11.4% |
| Interquartile 25% (IQ1) | 7.6% | 10.2% |
| Interquartile 75% (IQ3) | 10.9% | 13.1% |
| Interquartile Range (IQR) | 3.3% | 2.9% |
| Standard Deviation (Sample) | 5.2% | 3.0% |
| Standard Deviation (Population) | 5.2% | 3.0% |
Similar Demographics by Male Disability
Demographics Similar to Venezuelans by Male Disability
In terms of male disability, the demographic groups most similar to Venezuelans are Immigrants from Egypt (10.1%, a difference of 0.040%), Soviet Union (10.1%, a difference of 0.10%), Vietnamese (10.1%, a difference of 0.15%), Egyptian (10.1%, a difference of 0.17%), and Argentinean (10.1%, a difference of 0.25%).
| Demographics | Rating | Rank | Male Disability |
| Immigrants | Venezuela | 100.0 /100 | #22 | Exceptional 10.0% |
| Cypriots | 100.0 /100 | #23 | Exceptional 10.0% |
| Immigrants | Asia | 100.0 /100 | #24 | Exceptional 10.0% |
| Immigrants | Malaysia | 99.9 /100 | #25 | Exceptional 10.0% |
| Paraguayans | 99.9 /100 | #26 | Exceptional 10.1% |
| Egyptians | 99.9 /100 | #27 | Exceptional 10.1% |
| Vietnamese | 99.9 /100 | #28 | Exceptional 10.1% |
| Venezuelans | 99.9 /100 | #29 | Exceptional 10.1% |
| Immigrants | Egypt | 99.9 /100 | #30 | Exceptional 10.1% |
| Soviet Union | 99.9 /100 | #31 | Exceptional 10.1% |
| Argentineans | 99.9 /100 | #32 | Exceptional 10.1% |
| Immigrants | Ethiopia | 99.9 /100 | #33 | Exceptional 10.2% |
| Immigrants | Turkey | 99.9 /100 | #34 | Exceptional 10.2% |
| Immigrants | Argentina | 99.9 /100 | #35 | Exceptional 10.2% |
| Ethiopians | 99.8 /100 | #36 | Exceptional 10.2% |
Demographics Similar to Immigrants from Somalia by Male Disability
In terms of male disability, the demographic groups most similar to Immigrants from Somalia are Ukrainian (11.5%, a difference of 0.030%), Serbian (11.5%, a difference of 0.040%), Icelander (11.6%, a difference of 0.040%), Immigrants from Cambodia (11.5%, a difference of 0.050%), and Spanish American Indian (11.6%, a difference of 0.050%).
| Demographics | Rating | Rank | Male Disability |
| Immigrants | Iraq | 13.0 /100 | #200 | Poor 11.5% |
| Immigrants | Panama | 13.0 /100 | #201 | Poor 11.5% |
| Immigrants | Mexico | 12.6 /100 | #202 | Poor 11.5% |
| Jamaicans | 10.9 /100 | #203 | Poor 11.5% |
| Immigrants | Cambodia | 10.8 /100 | #204 | Poor 11.5% |
| Serbians | 10.7 /100 | #205 | Poor 11.5% |
| Ukrainians | 10.6 /100 | #206 | Poor 11.5% |
| Immigrants | Somalia | 10.4 /100 | #207 | Poor 11.5% |
| Icelanders | 10.1 /100 | #208 | Poor 11.6% |
| Spanish American Indians | 10.1 /100 | #209 | Poor 11.6% |
| Ute | 9.4 /100 | #210 | Tragic 11.6% |
| Immigrants | Thailand | 8.4 /100 | #211 | Tragic 11.6% |
| Immigrants | Scotland | 8.2 /100 | #212 | Tragic 11.6% |
| Mexican American Indians | 7.8 /100 | #213 | Tragic 11.6% |
| Lithuanians | 6.6 /100 | #214 | Tragic 11.6% |