Osage vs Kiowa Male Disability
COMPARE
Osage
Kiowa
Male Disability
Male Disability Comparison
Osage
Kiowa
14.0%
MALE DISABILITY
0.0/ 100
METRIC RATING
323rd/ 347
METRIC RANK
15.4%
MALE DISABILITY
0.0/ 100
METRIC RATING
342nd/ 347
METRIC RANK
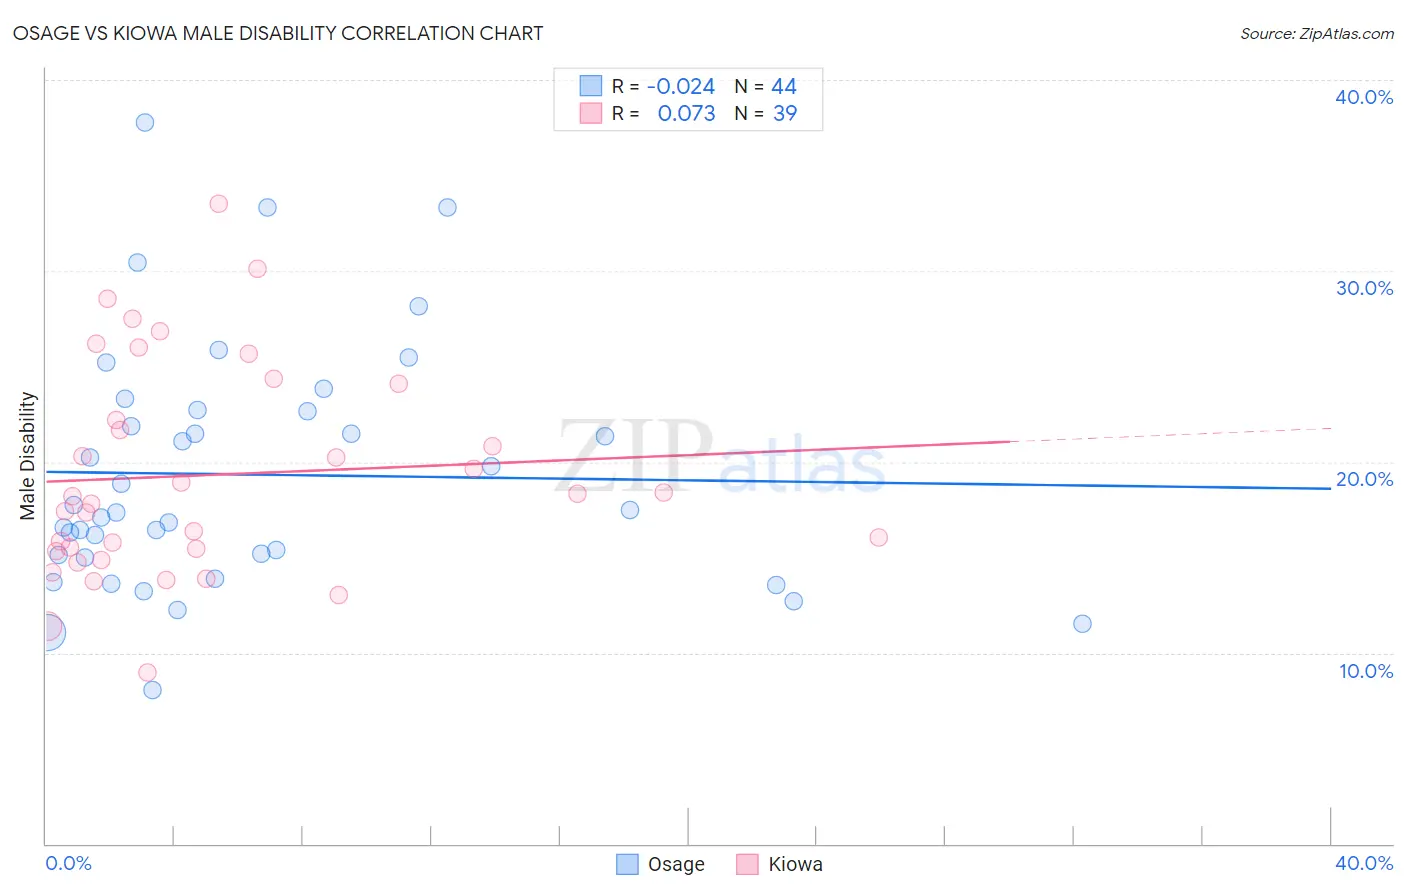
Osage vs Kiowa Male Disability Correlation Chart
The statistical analysis conducted on geographies consisting of 91,798,879 people shows no correlation between the proportion of Osage and percentage of males with a disability in the United States with a correlation coefficient (R) of -0.024 and weighted average of 14.0%. Similarly, the statistical analysis conducted on geographies consisting of 56,098,760 people shows a slight positive correlation between the proportion of Kiowa and percentage of males with a disability in the United States with a correlation coefficient (R) of 0.073 and weighted average of 15.4%, a difference of 10.1%.
Male Disability Correlation Summary
| Measurement | Osage | Kiowa |
| Minimum | 8.0% | 9.0% |
| Maximum | 37.7% | 33.5% |
| Range | 29.7% | 24.5% |
| Mean | 19.3% | 19.3% |
| Median | 17.4% | 18.2% |
| Interquartile 25% (IQ1) | 15.1% | 15.3% |
| Interquartile 75% (IQ3) | 22.7% | 24.1% |
| Interquartile Range (IQR) | 7.6% | 8.8% |
| Standard Deviation (Sample) | 6.4% | 5.6% |
| Standard Deviation (Population) | 6.4% | 5.5% |
Demographics Similar to Osage and Kiowa by Male Disability
In terms of male disability, the demographic groups most similar to Osage are Apache (14.0%, a difference of 0.070%), Comanche (14.1%, a difference of 0.33%), Ottawa (14.1%, a difference of 0.44%), Native/Alaskan (14.2%, a difference of 1.4%), and Potawatomi (14.2%, a difference of 1.5%). Similarly, the demographic groups most similar to Kiowa are Choctaw (15.4%, a difference of 0.19%), Lumbee (15.2%, a difference of 1.3%), Chickasaw (15.1%, a difference of 2.0%), Pueblo (15.0%, a difference of 2.9%), and Menominee (15.0%, a difference of 3.0%).
| Demographics | Rating | Rank | Male Disability |
| Apache | 0.0 /100 | #322 | Tragic 14.0% |
| Osage | 0.0 /100 | #323 | Tragic 14.0% |
| Comanche | 0.0 /100 | #324 | Tragic 14.1% |
| Ottawa | 0.0 /100 | #325 | Tragic 14.1% |
| Natives/Alaskans | 0.0 /100 | #326 | Tragic 14.2% |
| Potawatomi | 0.0 /100 | #327 | Tragic 14.2% |
| Chippewa | 0.0 /100 | #328 | Tragic 14.3% |
| Cajuns | 0.0 /100 | #329 | Tragic 14.4% |
| Navajo | 0.0 /100 | #330 | Tragic 14.4% |
| Tohono O'odham | 0.0 /100 | #331 | Tragic 14.6% |
| Seminole | 0.0 /100 | #332 | Tragic 14.7% |
| Yuman | 0.0 /100 | #333 | Tragic 14.7% |
| Cherokee | 0.0 /100 | #334 | Tragic 14.8% |
| Dutch West Indians | 0.0 /100 | #335 | Tragic 14.8% |
| Alaskan Athabascans | 0.0 /100 | #336 | Tragic 14.9% |
| Menominee | 0.0 /100 | #337 | Tragic 15.0% |
| Pueblo | 0.0 /100 | #338 | Tragic 15.0% |
| Chickasaw | 0.0 /100 | #339 | Tragic 15.1% |
| Lumbee | 0.0 /100 | #340 | Tragic 15.2% |
| Choctaw | 0.0 /100 | #341 | Tragic 15.4% |
| Kiowa | 0.0 /100 | #342 | Tragic 15.4% |