Osage vs Immigrants from Somalia Child Poverty Under the Age of 5
COMPARE
Osage
Immigrants from Somalia
Child Poverty Under the Age of 5
Child Poverty Under the Age of 5 Comparison
Osage
Immigrants from Somalia
19.6%
CHILD POVERTY UNDER THE AGE OF 5
0.5/ 100
METRIC RATING
243rd/ 347
METRIC RANK
21.6%
CHILD POVERTY UNDER THE AGE OF 5
0.0/ 100
METRIC RATING
292nd/ 347
METRIC RANK
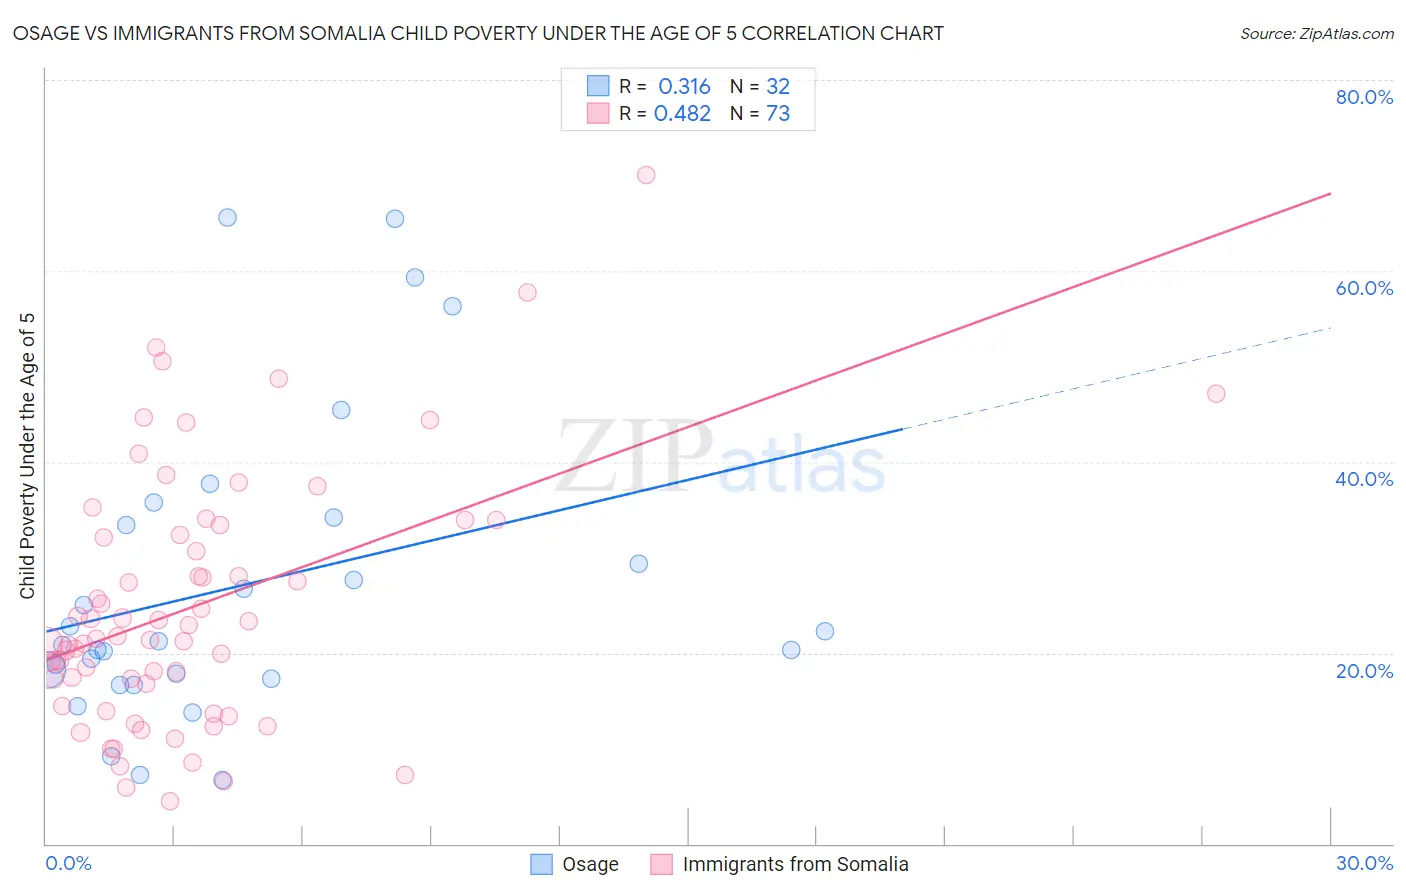
Osage vs Immigrants from Somalia Child Poverty Under the Age of 5 Correlation Chart
The statistical analysis conducted on geographies consisting of 90,936,218 people shows a mild positive correlation between the proportion of Osage and poverty level among children under the age of 5 in the United States with a correlation coefficient (R) of 0.316 and weighted average of 19.6%. Similarly, the statistical analysis conducted on geographies consisting of 91,565,484 people shows a moderate positive correlation between the proportion of Immigrants from Somalia and poverty level among children under the age of 5 in the United States with a correlation coefficient (R) of 0.482 and weighted average of 21.6%, a difference of 9.7%.
Child Poverty Under the Age of 5 Correlation Summary
| Measurement | Osage | Immigrants from Somalia |
| Minimum | 6.7% | 4.5% |
| Maximum | 65.6% | 70.0% |
| Range | 59.0% | 65.5% |
| Mean | 27.0% | 24.8% |
| Median | 21.0% | 21.5% |
| Interquartile 25% (IQ1) | 17.5% | 15.6% |
| Interquartile 75% (IQ3) | 33.8% | 32.8% |
| Interquartile Range (IQR) | 16.2% | 17.2% |
| Standard Deviation (Sample) | 15.9% | 13.3% |
| Standard Deviation (Population) | 15.6% | 13.2% |
Similar Demographics by Child Poverty Under the Age of 5
Demographics Similar to Osage by Child Poverty Under the Age of 5
In terms of child poverty under the age of 5, the demographic groups most similar to Osage are Immigrants from Ghana (19.6%, a difference of 0.020%), Immigrants from Guyana (19.6%, a difference of 0.10%), Immigrants from Western Africa (19.7%, a difference of 0.21%), Alaska Native (19.6%, a difference of 0.22%), and Immigrants from Ecuador (19.6%, a difference of 0.28%).
| Demographics | Rating | Rank | Child Poverty Under the Age of 5 |
| Immigrants | Trinidad and Tobago | 0.8 /100 | #236 | Tragic 19.4% |
| Immigrants | Cabo Verde | 0.6 /100 | #237 | Tragic 19.5% |
| Salvadorans | 0.6 /100 | #238 | Tragic 19.5% |
| Vietnamese | 0.6 /100 | #239 | Tragic 19.5% |
| Immigrants | Ecuador | 0.5 /100 | #240 | Tragic 19.6% |
| Alaska Natives | 0.5 /100 | #241 | Tragic 19.6% |
| Immigrants | Guyana | 0.5 /100 | #242 | Tragic 19.6% |
| Osage | 0.5 /100 | #243 | Tragic 19.6% |
| Immigrants | Ghana | 0.5 /100 | #244 | Tragic 19.6% |
| Immigrants | Western Africa | 0.4 /100 | #245 | Tragic 19.7% |
| Cree | 0.4 /100 | #246 | Tragic 19.7% |
| Guyanese | 0.4 /100 | #247 | Tragic 19.7% |
| Marshallese | 0.4 /100 | #248 | Tragic 19.7% |
| Immigrants | Middle Africa | 0.4 /100 | #249 | Tragic 19.7% |
| Immigrants | Nonimmigrants | 0.4 /100 | #250 | Tragic 19.7% |
Demographics Similar to Immigrants from Somalia by Child Poverty Under the Age of 5
In terms of child poverty under the age of 5, the demographic groups most similar to Immigrants from Somalia are Mexican (21.6%, a difference of 0.28%), Guatemalan (21.6%, a difference of 0.42%), British West Indian (21.4%, a difference of 0.60%), Cherokee (21.7%, a difference of 0.68%), and Immigrants from Caribbean (21.4%, a difference of 0.77%).
| Demographics | Rating | Rank | Child Poverty Under the Age of 5 |
| Haitians | 0.0 /100 | #285 | Tragic 21.2% |
| Immigrants | Latin America | 0.0 /100 | #286 | Tragic 21.2% |
| Immigrants | Zaire | 0.0 /100 | #287 | Tragic 21.3% |
| Immigrants | Senegal | 0.0 /100 | #288 | Tragic 21.3% |
| Immigrants | Haiti | 0.0 /100 | #289 | Tragic 21.3% |
| Immigrants | Caribbean | 0.0 /100 | #290 | Tragic 21.4% |
| British West Indians | 0.0 /100 | #291 | Tragic 21.4% |
| Immigrants | Somalia | 0.0 /100 | #292 | Tragic 21.6% |
| Mexicans | 0.0 /100 | #293 | Tragic 21.6% |
| Guatemalans | 0.0 /100 | #294 | Tragic 21.6% |
| Cherokee | 0.0 /100 | #295 | Tragic 21.7% |
| Yaqui | 0.0 /100 | #296 | Tragic 21.7% |
| Hispanics or Latinos | 0.0 /100 | #297 | Tragic 21.7% |
| Blackfeet | 0.0 /100 | #298 | Tragic 21.8% |
| Chickasaw | 0.0 /100 | #299 | Tragic 21.8% |