Blackfeet vs Immigrants from Somalia Male Disability
COMPARE
Blackfeet
Immigrants from Somalia
Male Disability
Male Disability Comparison
Blackfeet
Immigrants from Somalia
13.4%
MALE DISABILITY
0.0/ 100
METRIC RATING
309th/ 347
METRIC RANK
11.5%
MALE DISABILITY
10.4/ 100
METRIC RATING
207th/ 347
METRIC RANK
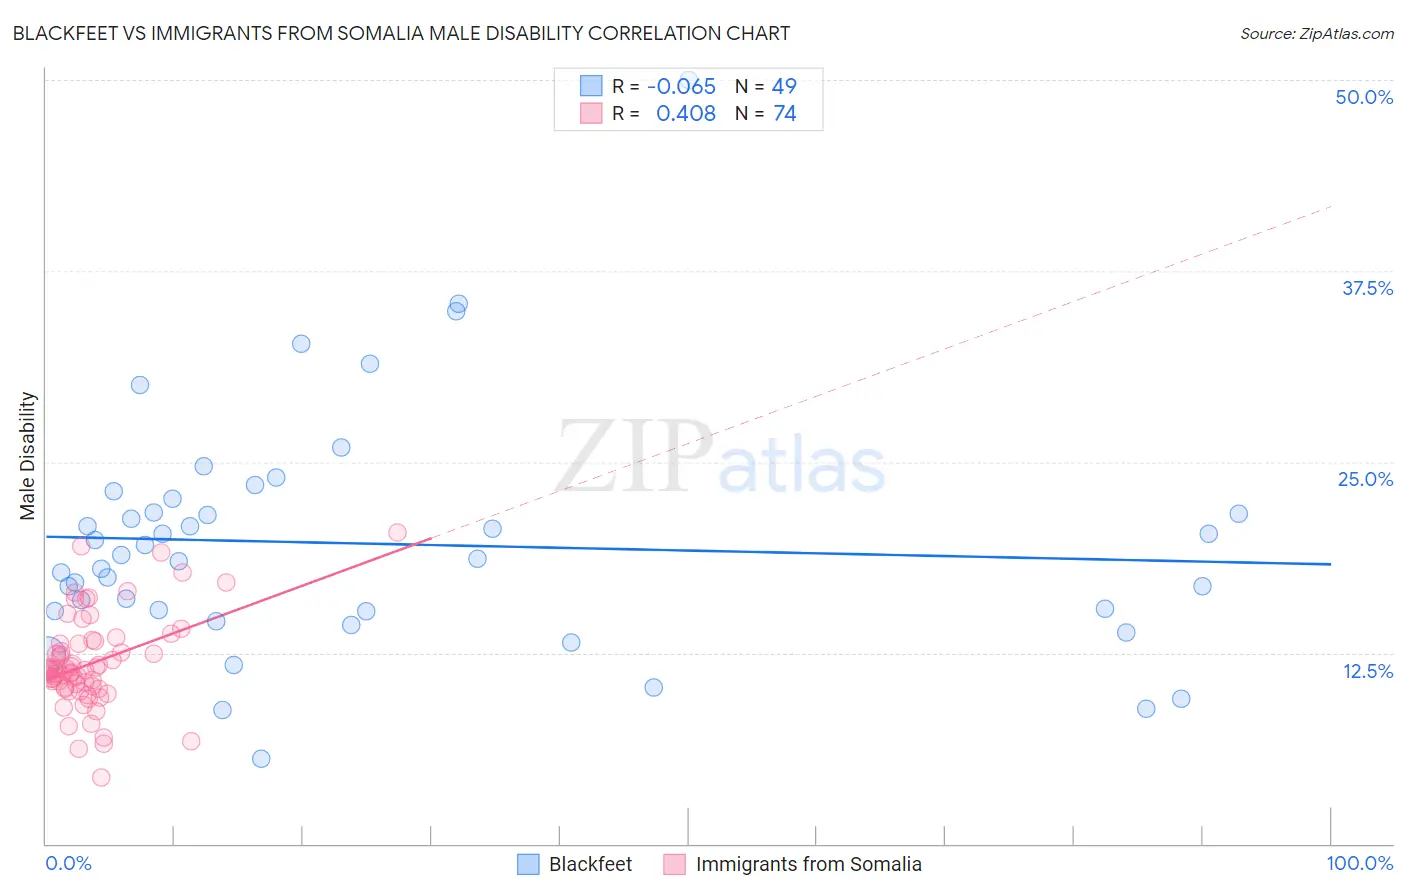
Blackfeet vs Immigrants from Somalia Male Disability Correlation Chart
The statistical analysis conducted on geographies consisting of 309,505,092 people shows a slight negative correlation between the proportion of Blackfeet and percentage of males with a disability in the United States with a correlation coefficient (R) of -0.065 and weighted average of 13.4%. Similarly, the statistical analysis conducted on geographies consisting of 92,107,608 people shows a moderate positive correlation between the proportion of Immigrants from Somalia and percentage of males with a disability in the United States with a correlation coefficient (R) of 0.408 and weighted average of 11.5%, a difference of 16.2%.
Male Disability Correlation Summary
| Measurement | Blackfeet | Immigrants from Somalia |
| Minimum | 5.6% | 4.4% |
| Maximum | 50.0% | 20.4% |
| Range | 44.4% | 16.0% |
| Mean | 19.6% | 11.8% |
| Median | 18.6% | 11.4% |
| Interquartile 25% (IQ1) | 15.2% | 10.2% |
| Interquartile 75% (IQ3) | 22.2% | 13.1% |
| Interquartile Range (IQR) | 6.9% | 2.9% |
| Standard Deviation (Sample) | 7.9% | 3.0% |
| Standard Deviation (Population) | 7.8% | 3.0% |
Similar Demographics by Male Disability
Demographics Similar to Blackfeet by Male Disability
In terms of male disability, the demographic groups most similar to Blackfeet are Immigrants from the Azores (13.4%, a difference of 0.14%), Delaware (13.5%, a difference of 0.33%), French American Indian (13.4%, a difference of 0.42%), Arapaho (13.3%, a difference of 0.58%), and Spanish American (13.3%, a difference of 0.80%).
| Demographics | Rating | Rank | Male Disability |
| Crow | 0.0 /100 | #302 | Tragic 13.1% |
| Scotch-Irish | 0.0 /100 | #303 | Tragic 13.2% |
| Blacks/African Americans | 0.0 /100 | #304 | Tragic 13.2% |
| French Canadians | 0.0 /100 | #305 | Tragic 13.3% |
| Spanish Americans | 0.0 /100 | #306 | Tragic 13.3% |
| Arapaho | 0.0 /100 | #307 | Tragic 13.3% |
| French American Indians | 0.0 /100 | #308 | Tragic 13.4% |
| Blackfeet | 0.0 /100 | #309 | Tragic 13.4% |
| Immigrants | Azores | 0.0 /100 | #310 | Tragic 13.4% |
| Delaware | 0.0 /100 | #311 | Tragic 13.5% |
| Yakama | 0.0 /100 | #312 | Tragic 13.5% |
| Puget Sound Salish | 0.0 /100 | #313 | Tragic 13.5% |
| Aleuts | 0.0 /100 | #314 | Tragic 13.5% |
| Iroquois | 0.0 /100 | #315 | Tragic 13.6% |
| Alaska Natives | 0.0 /100 | #316 | Tragic 13.6% |
Demographics Similar to Immigrants from Somalia by Male Disability
In terms of male disability, the demographic groups most similar to Immigrants from Somalia are Ukrainian (11.5%, a difference of 0.030%), Serbian (11.5%, a difference of 0.040%), Icelander (11.6%, a difference of 0.040%), Immigrants from Cambodia (11.5%, a difference of 0.050%), and Spanish American Indian (11.6%, a difference of 0.050%).
| Demographics | Rating | Rank | Male Disability |
| Immigrants | Iraq | 13.0 /100 | #200 | Poor 11.5% |
| Immigrants | Panama | 13.0 /100 | #201 | Poor 11.5% |
| Immigrants | Mexico | 12.6 /100 | #202 | Poor 11.5% |
| Jamaicans | 10.9 /100 | #203 | Poor 11.5% |
| Immigrants | Cambodia | 10.8 /100 | #204 | Poor 11.5% |
| Serbians | 10.7 /100 | #205 | Poor 11.5% |
| Ukrainians | 10.6 /100 | #206 | Poor 11.5% |
| Immigrants | Somalia | 10.4 /100 | #207 | Poor 11.5% |
| Icelanders | 10.1 /100 | #208 | Poor 11.6% |
| Spanish American Indians | 10.1 /100 | #209 | Poor 11.6% |
| Ute | 9.4 /100 | #210 | Tragic 11.6% |
| Immigrants | Thailand | 8.4 /100 | #211 | Tragic 11.6% |
| Immigrants | Scotland | 8.2 /100 | #212 | Tragic 11.6% |
| Mexican American Indians | 7.8 /100 | #213 | Tragic 11.6% |
| Lithuanians | 6.6 /100 | #214 | Tragic 11.6% |