Osage vs Immigrants from Somalia Associate's Degree
COMPARE
Osage
Immigrants from Somalia
Associate's Degree
Associate's Degree Comparison
Osage
Immigrants from Somalia
41.5%
ASSOCIATE'S DEGREE
0.3/ 100
METRIC RATING
264th/ 347
METRIC RANK
46.5%
ASSOCIATE'S DEGREE
55.5/ 100
METRIC RATING
168th/ 347
METRIC RANK
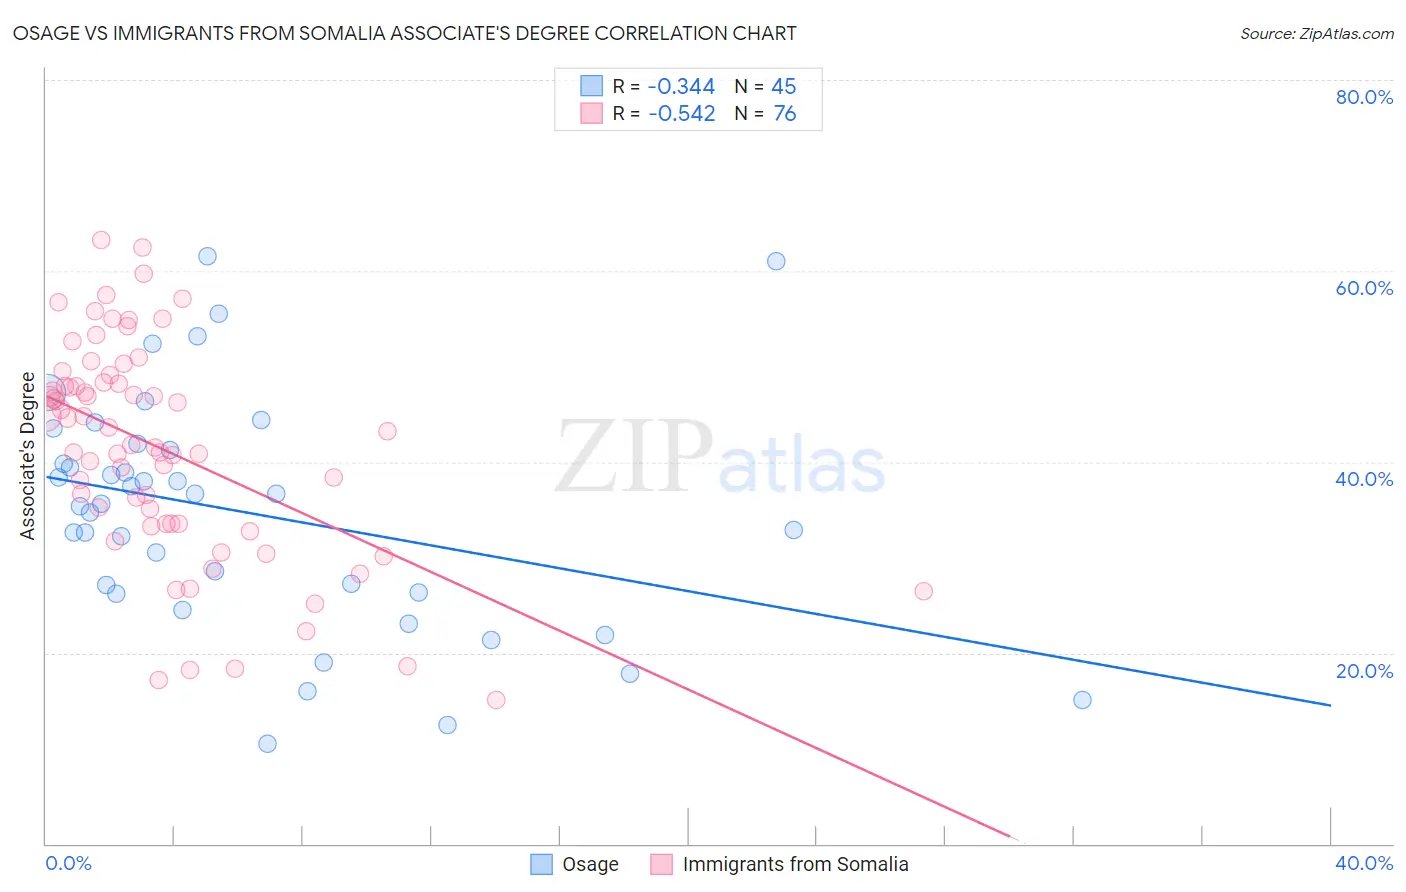
Osage vs Immigrants from Somalia Associate's Degree Correlation Chart
The statistical analysis conducted on geographies consisting of 91,808,929 people shows a mild negative correlation between the proportion of Osage and percentage of population with at least associate's degree education in the United States with a correlation coefficient (R) of -0.344 and weighted average of 41.5%. Similarly, the statistical analysis conducted on geographies consisting of 92,111,755 people shows a substantial negative correlation between the proportion of Immigrants from Somalia and percentage of population with at least associate's degree education in the United States with a correlation coefficient (R) of -0.542 and weighted average of 46.5%, a difference of 12.3%.
Associate's Degree Correlation Summary
| Measurement | Osage | Immigrants from Somalia |
| Minimum | 10.4% | 15.0% |
| Maximum | 61.5% | 63.3% |
| Range | 51.1% | 48.3% |
| Mean | 34.6% | 41.3% |
| Median | 35.6% | 42.5% |
| Interquartile 25% (IQ1) | 26.3% | 33.5% |
| Interquartile 75% (IQ3) | 41.5% | 48.3% |
| Interquartile Range (IQR) | 15.3% | 14.8% |
| Standard Deviation (Sample) | 12.2% | 11.3% |
| Standard Deviation (Population) | 12.1% | 11.2% |
Similar Demographics by Associate's Degree
Demographics Similar to Osage by Associate's Degree
In terms of associate's degree, the demographic groups most similar to Osage are Immigrants from Jamaica (41.5%, a difference of 0.010%), Bahamian (41.5%, a difference of 0.030%), Nicaraguan (41.5%, a difference of 0.12%), Marshallese (41.6%, a difference of 0.25%), and Malaysian (41.6%, a difference of 0.44%).
| Demographics | Rating | Rank | Associate's Degree |
| Spanish Americans | 0.5 /100 | #257 | Tragic 41.8% |
| Japanese | 0.5 /100 | #258 | Tragic 41.7% |
| Malaysians | 0.4 /100 | #259 | Tragic 41.6% |
| Marshallese | 0.4 /100 | #260 | Tragic 41.6% |
| Nicaraguans | 0.4 /100 | #261 | Tragic 41.5% |
| Bahamians | 0.4 /100 | #262 | Tragic 41.5% |
| Immigrants | Jamaica | 0.3 /100 | #263 | Tragic 41.5% |
| Osage | 0.3 /100 | #264 | Tragic 41.5% |
| Africans | 0.2 /100 | #265 | Tragic 41.1% |
| Samoans | 0.2 /100 | #266 | Tragic 41.1% |
| Hawaiians | 0.2 /100 | #267 | Tragic 40.9% |
| Central American Indians | 0.2 /100 | #268 | Tragic 40.8% |
| Americans | 0.2 /100 | #269 | Tragic 40.8% |
| Chippewa | 0.2 /100 | #270 | Tragic 40.7% |
| Immigrants | Laos | 0.1 /100 | #271 | Tragic 40.7% |
Demographics Similar to Immigrants from Somalia by Associate's Degree
In terms of associate's degree, the demographic groups most similar to Immigrants from Somalia are Uruguayan (46.5%, a difference of 0.010%), Irish (46.5%, a difference of 0.14%), Basque (46.5%, a difference of 0.20%), Hungarian (46.7%, a difference of 0.29%), and Immigrants from Sierra Leone (46.7%, a difference of 0.29%).
| Demographics | Rating | Rank | Associate's Degree |
| Scandinavians | 65.2 /100 | #161 | Good 46.9% |
| Immigrants | Africa | 63.2 /100 | #162 | Good 46.8% |
| Somalis | 62.5 /100 | #163 | Good 46.8% |
| Colombians | 62.4 /100 | #164 | Good 46.8% |
| Immigrants | South America | 59.9 /100 | #165 | Average 46.7% |
| Hungarians | 59.3 /100 | #166 | Average 46.7% |
| Immigrants | Sierra Leone | 59.2 /100 | #167 | Average 46.7% |
| Immigrants | Somalia | 55.5 /100 | #168 | Average 46.5% |
| Uruguayans | 55.4 /100 | #169 | Average 46.5% |
| Irish | 53.6 /100 | #170 | Average 46.5% |
| Basques | 52.8 /100 | #171 | Average 46.5% |
| Peruvians | 50.5 /100 | #172 | Average 46.4% |
| Immigrants | Iraq | 50.3 /100 | #173 | Average 46.4% |
| English | 50.0 /100 | #174 | Average 46.4% |
| Belgians | 48.9 /100 | #175 | Average 46.3% |