Osage vs Pueblo Male Disability
COMPARE
Osage
Pueblo
Male Disability
Male Disability Comparison
Osage
Pueblo
14.0%
MALE DISABILITY
0.0/ 100
METRIC RATING
323rd/ 347
METRIC RANK
15.0%
MALE DISABILITY
0.0/ 100
METRIC RATING
338th/ 347
METRIC RANK
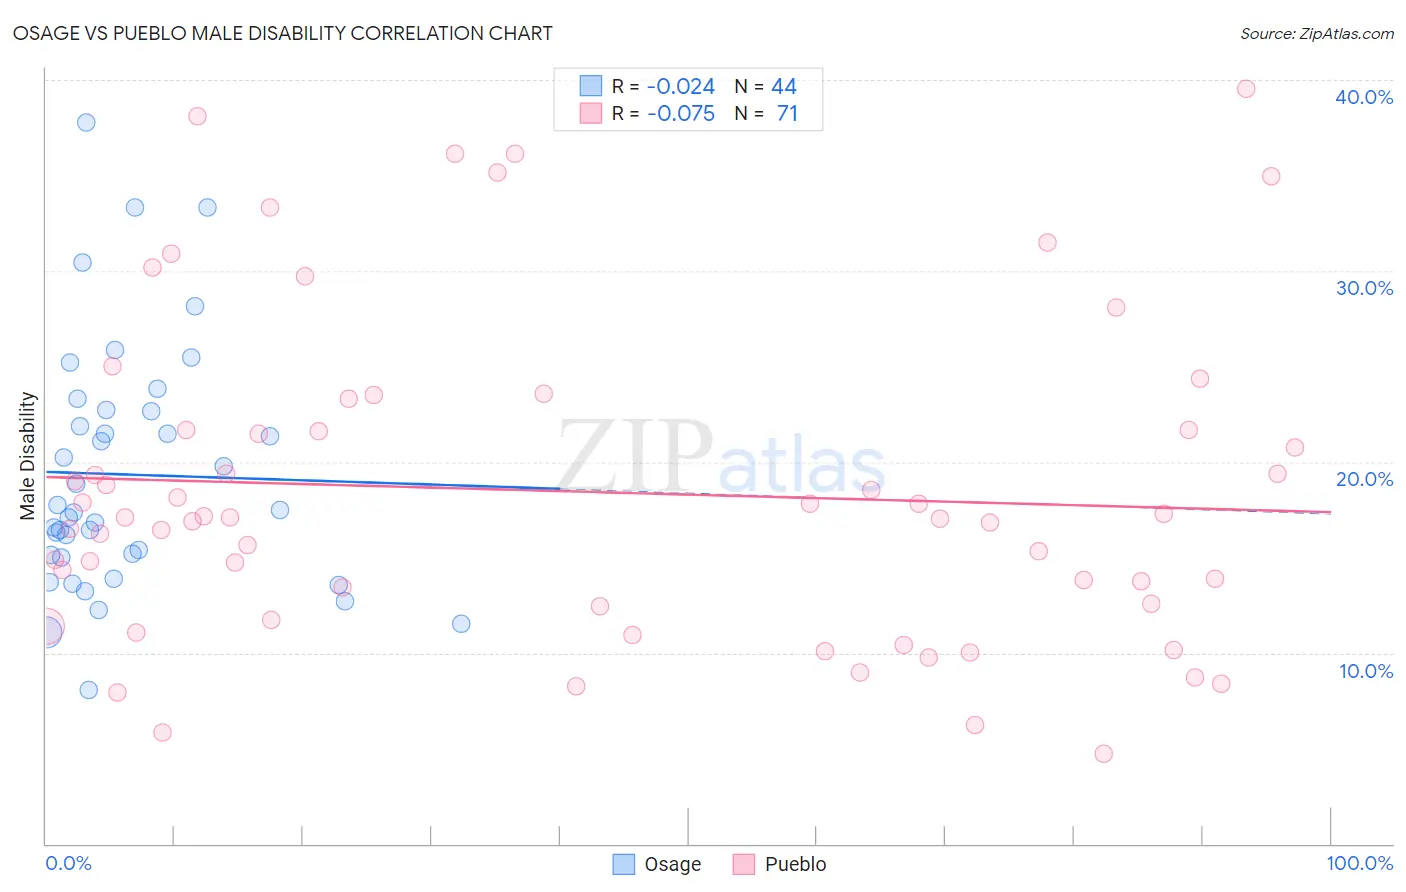
Osage vs Pueblo Male Disability Correlation Chart
The statistical analysis conducted on geographies consisting of 91,798,879 people shows no correlation between the proportion of Osage and percentage of males with a disability in the United States with a correlation coefficient (R) of -0.024 and weighted average of 14.0%. Similarly, the statistical analysis conducted on geographies consisting of 120,077,979 people shows a slight negative correlation between the proportion of Pueblo and percentage of males with a disability in the United States with a correlation coefficient (R) of -0.075 and weighted average of 15.0%, a difference of 7.1%.
Male Disability Correlation Summary
| Measurement | Osage | Pueblo |
| Minimum | 8.0% | 4.7% |
| Maximum | 37.7% | 39.5% |
| Range | 29.7% | 34.8% |
| Mean | 19.3% | 18.4% |
| Median | 17.4% | 17.1% |
| Interquartile 25% (IQ1) | 15.1% | 12.4% |
| Interquartile 75% (IQ3) | 22.7% | 21.7% |
| Interquartile Range (IQR) | 7.6% | 9.2% |
| Standard Deviation (Sample) | 6.4% | 8.4% |
| Standard Deviation (Population) | 6.4% | 8.3% |
Demographics Similar to Osage and Pueblo by Male Disability
In terms of male disability, the demographic groups most similar to Osage are Apache (14.0%, a difference of 0.070%), Comanche (14.1%, a difference of 0.33%), Ottawa (14.1%, a difference of 0.44%), Shoshone (13.8%, a difference of 1.2%), and Tlingit-Haida (13.8%, a difference of 1.3%). Similarly, the demographic groups most similar to Pueblo are Menominee (15.0%, a difference of 0.11%), Alaskan Athabascan (14.9%, a difference of 0.62%), Chickasaw (15.1%, a difference of 0.80%), Dutch West Indian (14.8%, a difference of 1.1%), and Cherokee (14.8%, a difference of 1.1%).
| Demographics | Rating | Rank | Male Disability |
| Tlingit-Haida | 0.0 /100 | #320 | Tragic 13.8% |
| Shoshone | 0.0 /100 | #321 | Tragic 13.8% |
| Apache | 0.0 /100 | #322 | Tragic 14.0% |
| Osage | 0.0 /100 | #323 | Tragic 14.0% |
| Comanche | 0.0 /100 | #324 | Tragic 14.1% |
| Ottawa | 0.0 /100 | #325 | Tragic 14.1% |
| Natives/Alaskans | 0.0 /100 | #326 | Tragic 14.2% |
| Potawatomi | 0.0 /100 | #327 | Tragic 14.2% |
| Chippewa | 0.0 /100 | #328 | Tragic 14.3% |
| Cajuns | 0.0 /100 | #329 | Tragic 14.4% |
| Navajo | 0.0 /100 | #330 | Tragic 14.4% |
| Tohono O'odham | 0.0 /100 | #331 | Tragic 14.6% |
| Seminole | 0.0 /100 | #332 | Tragic 14.7% |
| Yuman | 0.0 /100 | #333 | Tragic 14.7% |
| Cherokee | 0.0 /100 | #334 | Tragic 14.8% |
| Dutch West Indians | 0.0 /100 | #335 | Tragic 14.8% |
| Alaskan Athabascans | 0.0 /100 | #336 | Tragic 14.9% |
| Menominee | 0.0 /100 | #337 | Tragic 15.0% |
| Pueblo | 0.0 /100 | #338 | Tragic 15.0% |
| Chickasaw | 0.0 /100 | #339 | Tragic 15.1% |
| Lumbee | 0.0 /100 | #340 | Tragic 15.2% |