Swedish vs Immigrants from China Male Disability

COMPARE

Swedish
Race
Ancestry
AfghanAfricanAlaska NativeAlaskan AthabascanAlbanianAleutAlsatianAmericanApacheArabArapahoArgentineanArmenianAssyrian/Chaldean/SyriacAustralianAustrianBahamianBangladeshiBarbadianBasqueBelgianBelizeanBermudanBhutaneseBlackfeetBolivianBrazilianBritishBritish West IndianBulgarianBurmeseCajunCambodianCanadianCape VerdeanCarpatho RusynCelticCentral AmericanCentral American IndianCherokeeCheyenneChickasawChileanChineseChippewaChoctawColombianColvilleComancheCosta RicanCreeCreekCroatianCrowCubanCypriotCzechCzechoslovakianDanishDelawareDominicanDutchDutch West IndianEastern EuropeanEcuadorianEgyptianEnglishEstonianEthiopianEuropeanFijianFilipinoFinnishFrenchFrench American IndianFrench CanadianGermanGerman RussianGhanaianGreekGuamanian/ChamorroGuatemalanGuyaneseHaitianHmongHonduranHopiHoumaHungarianIcelanderIndian (Asian)IndonesianInupiatIranianIraqiIrishIroquoisIsraeliItalianJamaicanJapaneseJordanianKenyanKiowaKoreanLaotianLatvianLebaneseLiberianLithuanianLumbeeLuxembourgerMacedonianMalaysianMalteseMarshalleseMenomineeMexicanMexican American IndianMongolianMoroccanNative HawaiianNavajoNepaleseNew ZealanderNicaraguanNigerianNorthern EuropeanNorwegianOkinawanOsageOttawaPaiutePakistaniPalestinianPanamanianParaguayanPennsylvania GermanPeruvianPimaPolishPortuguesePotawatomiPuebloPuerto RicanPuget Sound SalishRomanianRussianSalvadoranSamoanScandinavianScotch-IrishScottishSeminoleSenegaleseSerbianShoshoneSierra LeoneanSiouxSlavicSlovakSloveneSomaliSouth AfricanSouth AmericanSouth American IndianSoviet UnionSpaniardSpanishSpanish AmericanSpanish American IndianSri LankanSubsaharan AfricanSudaneseSwedishSwissSyrianTaiwaneseThaiTlingit-HaidaTohono O'OdhamTonganTrinidadian and TobagonianTsimshianTurkishU.S. Virgin IslanderUgandanUkrainianUruguayanUteVenezuelanVietnameseWelshWest IndianYakamaYaquiYugoslavianYumanYup'ikZimbabwean
Immigration
NonimmigrantsImmigrantsAfghanistanAfricaAlbaniaArgentinaArmeniaAsiaAustraliaAustriaBahamasBangladeshBarbadosBelarusBelgiumBelizeBoliviaBosnia and HerzegovinaBrazilBulgariaBurma/MyanmarCabo VerdeCambodiaCameroonCanadaCaribbeanCentral AmericaChileColombiaCongoCosta RicaCroatiaCubaCzechoslovakiaDenmarkDominicaDominican RepublicEastern AfricaEastern AsiaEastern EuropeEcuadorEgyptEl SalvadorEnglandEritreaEthiopiaEuropeFijiFranceGermanyGhanaGreeceGrenadaGuatemalaGuyanaHaitiHondurasHong KongHungaryIndiaIndonesiaIranIraqIrelandIsraelItalyJamaicaJapanJordanKazakhstanKenyaKoreaKuwaitLaosLatin AmericaLatviaLebanonLiberiaLithuaniaMalaysiaMexicoMicronesiaMiddle AfricaMoldovaMoroccoNepalNetherlandsNicaraguaNigeriaNorth AmericaNorth MacedoniaNorthern AfricaNorthern EuropeNorwayOceaniaPakistanPanamaPeruPhilippinesPolandPortugalRomaniaRussiaSaudi ArabiaScotlandSenegalSerbiaSierra LeoneSingaporeSomaliaSouth AfricaSouth AmericaSouth Central AsiaSouth Eastern AsiaSouthern EuropeSpainSri LankaSt. Vincent and the GrenadinesSudanSwedenSwitzerlandSyriaTaiwanThailandTrinidad and TobagoTurkeyUgandaUkraineUruguayUzbekistanVenezuelaVietnamWest IndiesWestern AfricaWestern AsiaWestern EuropeYemenZaireZimbabweAzores
Immigrants from China
Race
Ancestry
AfghanAfricanAlaska NativeAlaskan AthabascanAlbanianAleutAlsatianAmericanApacheArabArapahoArgentineanArmenianAssyrian/Chaldean/SyriacAustralianAustrianBahamianBangladeshiBarbadianBasqueBelgianBelizeanBermudanBhutaneseBlackfeetBolivianBrazilianBritishBritish West IndianBulgarianBurmeseCajunCambodianCanadianCape VerdeanCarpatho RusynCelticCentral AmericanCentral American IndianCherokeeCheyenneChickasawChileanChineseChippewaChoctawColombianColvilleComancheCosta RicanCreeCreekCroatianCrowCubanCypriotCzechCzechoslovakianDanishDelawareDominicanDutchDutch West IndianEastern EuropeanEcuadorianEgyptianEnglishEstonianEthiopianEuropeanFijianFilipinoFinnishFrenchFrench American IndianFrench CanadianGermanGerman RussianGhanaianGreekGuamanian/ChamorroGuatemalanGuyaneseHaitianHmongHonduranHopiHoumaHungarianIcelanderIndian (Asian)IndonesianInupiatIranianIraqiIrishIroquoisIsraeliItalianJamaicanJapaneseJordanianKenyanKiowaKoreanLaotianLatvianLebaneseLiberianLithuanianLumbeeLuxembourgerMacedonianMalaysianMalteseMarshalleseMenomineeMexicanMexican American IndianMongolianMoroccanNative HawaiianNavajoNepaleseNew ZealanderNicaraguanNigerianNorthern EuropeanNorwegianOkinawanOsageOttawaPaiutePakistaniPalestinianPanamanianParaguayanPennsylvania GermanPeruvianPimaPolishPortuguesePotawatomiPuebloPuerto RicanPuget Sound SalishRomanianRussianSalvadoranSamoanScandinavianScotch-IrishScottishSeminoleSenegaleseSerbianShoshoneSierra LeoneanSiouxSlavicSlovakSloveneSomaliSouth AfricanSouth AmericanSouth American IndianSoviet UnionSpaniardSpanishSpanish AmericanSpanish American IndianSri LankanSubsaharan AfricanSudaneseSwissSyrianTaiwaneseThaiTlingit-HaidaTohono O'OdhamTonganTrinidadian and TobagonianTsimshianTurkishU.S. Virgin IslanderUgandanUkrainianUruguayanUteVenezuelanVietnameseWelshWest IndianYakamaYaquiYugoslavianYumanYup'ikZimbabwean
Immigration
NonimmigrantsImmigrantsAfghanistanAfricaAlbaniaArgentinaArmeniaAsiaAustraliaAustriaBahamasBangladeshBarbadosBelarusBelgiumBelizeBoliviaBosnia and HerzegovinaBrazilBulgariaBurma/MyanmarCabo VerdeCambodiaCameroonCanadaCaribbeanCentral AmericaChileChinaColombiaCongoCosta RicaCroatiaCubaCzechoslovakiaDenmarkDominicaDominican RepublicEastern AfricaEastern AsiaEastern EuropeEcuadorEgyptEl SalvadorEnglandEritreaEthiopiaEuropeFijiFranceGermanyGhanaGreeceGrenadaGuatemalaGuyanaHaitiHondurasHong KongHungaryIndiaIndonesiaIranIraqIrelandIsraelItalyJamaicaJapanJordanKazakhstanKenyaKoreaKuwaitLaosLatin AmericaLatviaLebanonLiberiaLithuaniaMalaysiaMexicoMicronesiaMiddle AfricaMoldovaMoroccoNepalNetherlandsNicaraguaNigeriaNorth AmericaNorth MacedoniaNorthern AfricaNorthern EuropeNorwayOceaniaPakistanPanamaPeruPhilippinesPolandPortugalRomaniaRussiaSaudi ArabiaScotlandSenegalSerbiaSierra LeoneSingaporeSomaliaSouth AfricaSouth AmericaSouth Central AsiaSouth Eastern AsiaSouthern EuropeSpainSri LankaSt. Vincent and the GrenadinesSudanSwedenSwitzerlandSyriaTaiwanThailandTrinidad and TobagoTurkeyUgandaUkraineUruguayUzbekistanVenezuelaVietnamWest IndiesWestern AfricaWestern AsiaWestern EuropeYemenZaireZimbabweAzores
Male Disability
Income
Poverty
Unemployment
Labor Participation
Family Structure
Vehicle Availability
Education Level
Disability

Male Disability Comparison

Swedes

Immigrants from China

Tragic
Exceptional
12.1%
MALE DISABILITY
0.3/ 100
METRIC RATING
260th/ 347
METRIC RANK
9.5%
MALE DISABILITY
100.0/ 100
METRIC RATING
8th/ 347
METRIC RANK

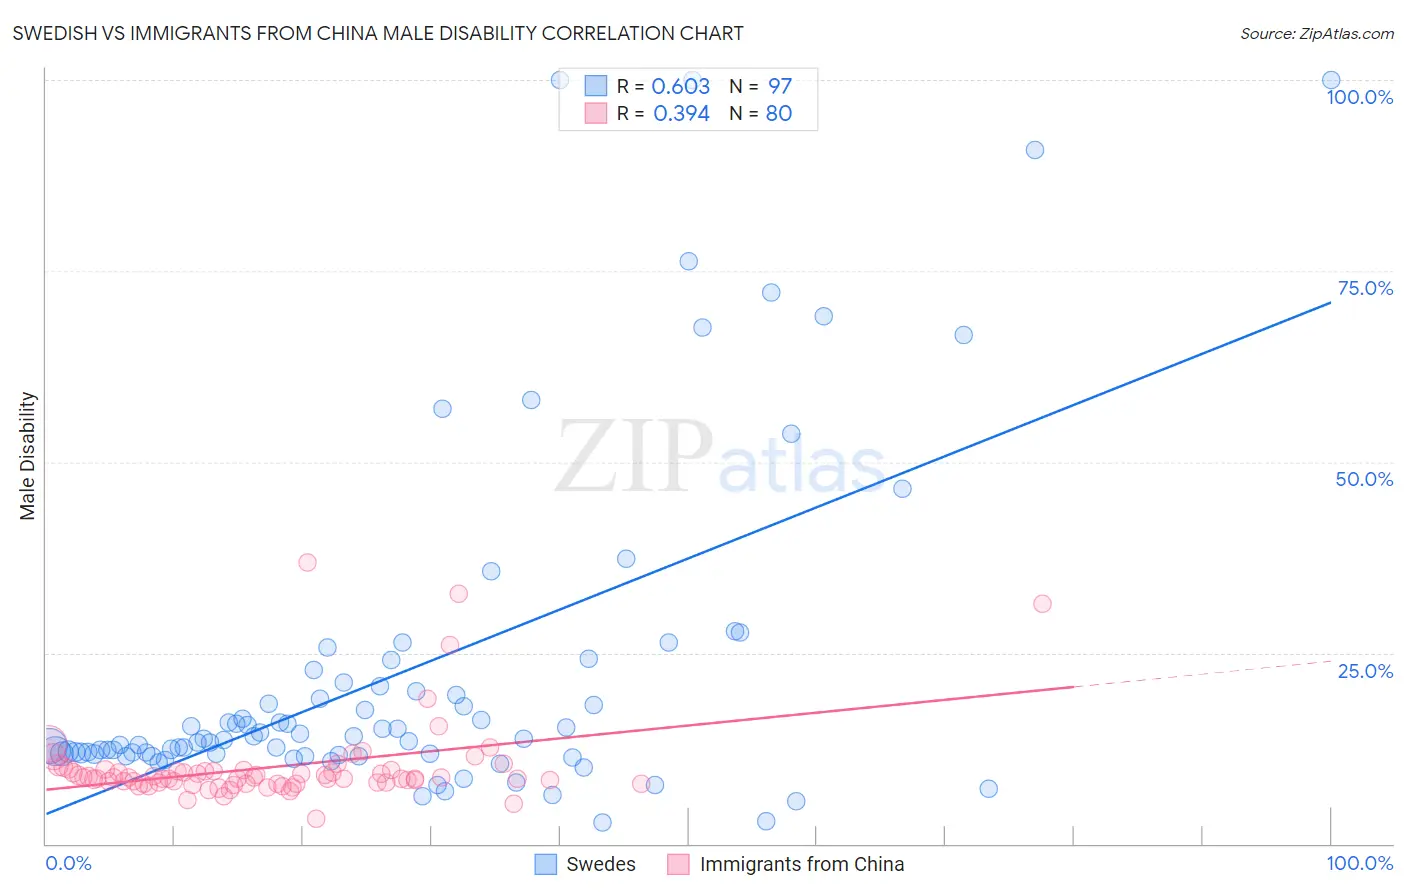
Swedish vs Immigrants from China Male Disability Correlation Chart

The statistical analysis conducted on geographies consisting of 539,057,565 people shows a significant positive correlation between the proportion of Swedes and percentage of males with a disability in the United States with a correlation coefficient (R) of 0.603 and weighted average of 12.1%. Similarly, the statistical analysis conducted on geographies consisting of 457,000,034 people shows a mild positive correlation between the proportion of Immigrants from China and percentage of males with a disability in the United States with a correlation coefficient (R) of 0.394 and weighted average of 9.5%, a difference of 27.5%.
Swedish vs Immigrants from China Male Disability

Male Disability Correlation Summary

MeasurementSwedishImmigrants from China
Minimum2.9%3.2%
Maximum100.0%36.8%
Range97.1%33.5%
Mean22.4%10.0%
Median13.7%8.6%
Interquartile 25% (IQ1)11.7%8.0%
Interquartile 75% (IQ3)20.8%9.6%
Interquartile Range (IQR)9.1%1.6%
Standard Deviation (Sample)22.1%5.5%
Standard Deviation (Population)22.0%5.4%

Similar Demographics by Male Disability

Demographics Similar to Swedes by Male Disability

In terms of male disability, the demographic groups most similar to Swedes are Belgian (12.1%, a difference of 0.070%), Basque (12.1%, a difference of 0.12%), Swiss (12.1%, a difference of 0.31%), European (12.1%, a difference of 0.31%), and Slavic (12.2%, a difference of 0.36%).
DemographicsRating | RankMale Disability
Guamanians/Chamorros
0.5
/100
|
#253
Tragic
12.0%
British
0.4
/100
|
#254
Tragic
12.1%
Chinese
0.4
/100
|
#255
Tragic
12.1%
Swiss
0.3
/100
|
#256
Tragic
12.1%
Europeans
0.3
/100
|
#257
Tragic
12.1%
Basques
0.3
/100
|
#258
Tragic
12.1%
Belgians
0.3
/100
|
#259
Tragic
12.1%
Swedes
0.3
/100
|
#260
Tragic
12.1%
Slavs
0.2
/100
|
#261
Tragic
12.2%
Norwegians
0.2
/100
|
#262
Tragic
12.2%
Canadians
0.2
/100
|
#263
Tragic
12.2%
Nepalese
0.2
/100
|
#264
Tragic
12.2%
Immigrants | Portugal
0.1
/100
|
#265
Tragic
12.3%
Hawaiians
0.1
/100
|
#266
Tragic
12.3%
Immigrants | Germany
0.1
/100
|
#267
Tragic
12.3%

Demographics Similar to Immigrants from China by Male Disability

In terms of male disability, the demographic groups most similar to Immigrants from China are Immigrants from Singapore (9.5%, a difference of 0.080%), Immigrants from Israel (9.6%, a difference of 0.51%), Immigrants from Bolivia (9.5%, a difference of 0.60%), Immigrants from South Central Asia (9.4%, a difference of 0.93%), and Immigrants from Hong Kong (9.4%, a difference of 0.99%).
DemographicsRating | RankMale Disability
Immigrants | India
100.0
/100
|
#1
Exceptional
9.0%
Immigrants | Taiwan
100.0
/100
|
#2
Exceptional
9.1%
Filipinos
100.0
/100
|
#3
Exceptional
9.1%
Thais
100.0
/100
|
#4
Exceptional
9.2%
Immigrants | Hong Kong
100.0
/100
|
#5
Exceptional
9.4%
Immigrants | South Central Asia
100.0
/100
|
#6
Exceptional
9.4%
Immigrants | Bolivia
100.0
/100
|
#7
Exceptional
9.5%
Immigrants | China
100.0
/100
|
#8
Exceptional
9.5%
Immigrants | Singapore
100.0
/100
|
#9
Exceptional
9.5%
Immigrants | Israel
100.0
/100
|
#10
Exceptional
9.6%
Immigrants | Eastern Asia
100.0
/100
|
#11
Exceptional
9.6%
Bolivians
100.0
/100
|
#12
Exceptional
9.6%
Iranians
100.0
/100
|
#13
Exceptional
9.7%
Immigrants | Iran
100.0
/100
|
#14
Exceptional
9.7%
Indians (Asian)
100.0
/100
|
#15
Exceptional
9.7%