Immigrants from Burma/Myanmar vs Immigrants from China Male Disability
COMPARE
Immigrants from Burma/Myanmar
Immigrants from China
Male Disability
Male Disability Comparison
Immigrants from Burma/Myanmar
Immigrants from China
11.2%
MALE DISABILITY
50.4/ 100
METRIC RATING
173rd/ 347
METRIC RANK
9.5%
MALE DISABILITY
100.0/ 100
METRIC RATING
8th/ 347
METRIC RANK
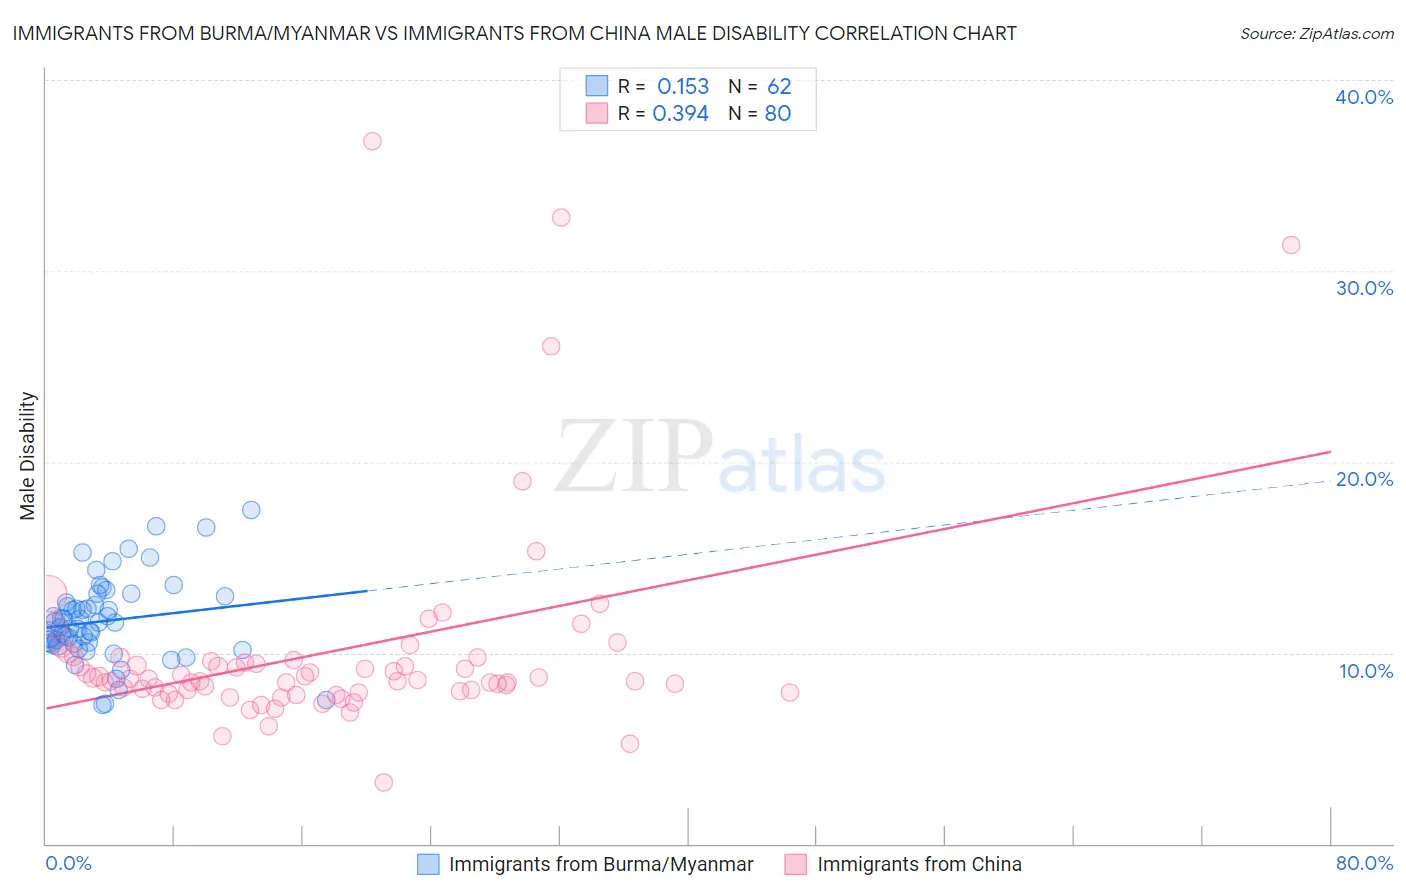
Immigrants from Burma/Myanmar vs Immigrants from China Male Disability Correlation Chart
The statistical analysis conducted on geographies consisting of 172,332,425 people shows a poor positive correlation between the proportion of Immigrants from Burma/Myanmar and percentage of males with a disability in the United States with a correlation coefficient (R) of 0.153 and weighted average of 11.2%. Similarly, the statistical analysis conducted on geographies consisting of 457,000,034 people shows a mild positive correlation between the proportion of Immigrants from China and percentage of males with a disability in the United States with a correlation coefficient (R) of 0.394 and weighted average of 9.5%, a difference of 17.8%.
Male Disability Correlation Summary
| Measurement | Immigrants from Burma/Myanmar | Immigrants from China |
| Minimum | 7.3% | 3.2% |
| Maximum | 17.5% | 36.8% |
| Range | 10.2% | 33.5% |
| Mean | 11.7% | 10.0% |
| Median | 11.4% | 8.6% |
| Interquartile 25% (IQ1) | 10.5% | 8.0% |
| Interquartile 75% (IQ3) | 12.6% | 9.6% |
| Interquartile Range (IQR) | 2.1% | 1.6% |
| Standard Deviation (Sample) | 2.2% | 5.5% |
| Standard Deviation (Population) | 2.1% | 5.4% |
Similar Demographics by Male Disability
Demographics Similar to Immigrants from Burma/Myanmar by Male Disability
In terms of male disability, the demographic groups most similar to Immigrants from Burma/Myanmar are Romanian (11.2%, a difference of 0.020%), Maltese (11.2%, a difference of 0.020%), Immigrants from Honduras (11.2%, a difference of 0.10%), Haitian (11.2%, a difference of 0.12%), and New Zealander (11.2%, a difference of 0.14%).
| Demographics | Rating | Rank | Male Disability |
| Immigrants | Hungary | 61.2 /100 | #166 | Good 11.1% |
| Immigrants | Southern Europe | 54.4 /100 | #167 | Average 11.2% |
| Immigrants | Latin America | 54.0 /100 | #168 | Average 11.2% |
| Barbadians | 53.4 /100 | #169 | Average 11.2% |
| New Zealanders | 52.9 /100 | #170 | Average 11.2% |
| Haitians | 52.5 /100 | #171 | Average 11.2% |
| Romanians | 50.7 /100 | #172 | Average 11.2% |
| Immigrants | Burma/Myanmar | 50.4 /100 | #173 | Average 11.2% |
| Maltese | 50.0 /100 | #174 | Average 11.2% |
| Immigrants | Honduras | 48.7 /100 | #175 | Average 11.2% |
| Syrians | 46.6 /100 | #176 | Average 11.2% |
| Immigrants | Norway | 44.2 /100 | #177 | Average 11.3% |
| Australians | 42.2 /100 | #178 | Average 11.3% |
| Immigrants | Caribbean | 41.4 /100 | #179 | Average 11.3% |
| Hondurans | 41.1 /100 | #180 | Average 11.3% |
Demographics Similar to Immigrants from China by Male Disability
In terms of male disability, the demographic groups most similar to Immigrants from China are Immigrants from Singapore (9.5%, a difference of 0.080%), Immigrants from Israel (9.6%, a difference of 0.51%), Immigrants from Bolivia (9.5%, a difference of 0.60%), Immigrants from South Central Asia (9.4%, a difference of 0.93%), and Immigrants from Hong Kong (9.4%, a difference of 0.99%).
| Demographics | Rating | Rank | Male Disability |
| Immigrants | India | 100.0 /100 | #1 | Exceptional 9.0% |
| Immigrants | Taiwan | 100.0 /100 | #2 | Exceptional 9.1% |
| Filipinos | 100.0 /100 | #3 | Exceptional 9.1% |
| Thais | 100.0 /100 | #4 | Exceptional 9.2% |
| Immigrants | Hong Kong | 100.0 /100 | #5 | Exceptional 9.4% |
| Immigrants | South Central Asia | 100.0 /100 | #6 | Exceptional 9.4% |
| Immigrants | Bolivia | 100.0 /100 | #7 | Exceptional 9.5% |
| Immigrants | China | 100.0 /100 | #8 | Exceptional 9.5% |
| Immigrants | Singapore | 100.0 /100 | #9 | Exceptional 9.5% |
| Immigrants | Israel | 100.0 /100 | #10 | Exceptional 9.6% |
| Immigrants | Eastern Asia | 100.0 /100 | #11 | Exceptional 9.6% |
| Bolivians | 100.0 /100 | #12 | Exceptional 9.6% |
| Iranians | 100.0 /100 | #13 | Exceptional 9.7% |
| Immigrants | Iran | 100.0 /100 | #14 | Exceptional 9.7% |
| Indians (Asian) | 100.0 /100 | #15 | Exceptional 9.7% |