Irish vs Immigrants from China Male Disability
COMPARE
Irish
Immigrants from China
Male Disability
Male Disability Comparison
Irish
Immigrants from China
12.7%
MALE DISABILITY
0.0/ 100
METRIC RATING
282nd/ 347
METRIC RANK
9.5%
MALE DISABILITY
100.0/ 100
METRIC RATING
8th/ 347
METRIC RANK
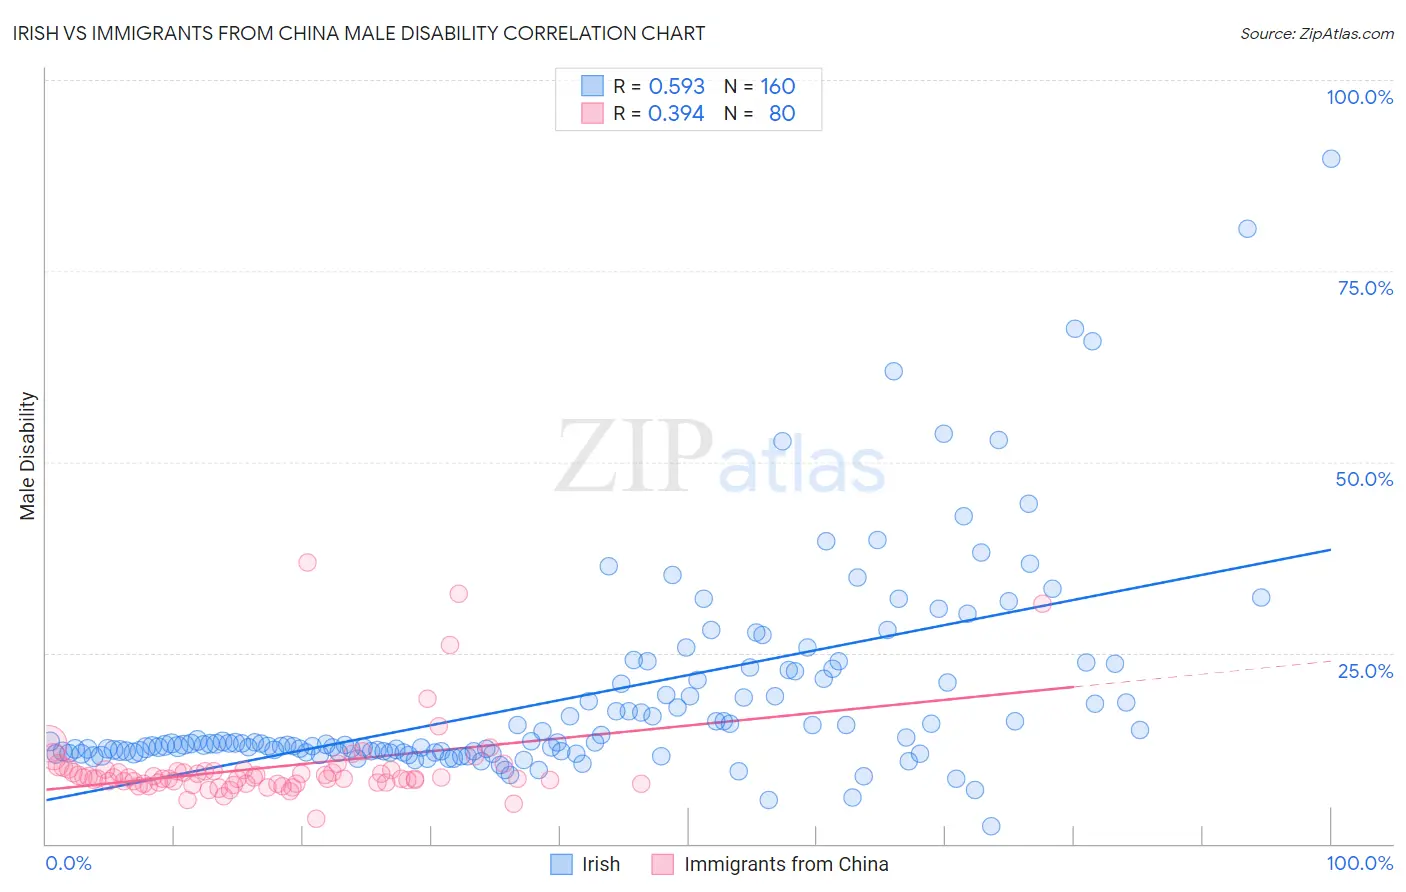
Irish vs Immigrants from China Male Disability Correlation Chart
The statistical analysis conducted on geographies consisting of 580,201,634 people shows a substantial positive correlation between the proportion of Irish and percentage of males with a disability in the United States with a correlation coefficient (R) of 0.593 and weighted average of 12.7%. Similarly, the statistical analysis conducted on geographies consisting of 457,000,034 people shows a mild positive correlation between the proportion of Immigrants from China and percentage of males with a disability in the United States with a correlation coefficient (R) of 0.394 and weighted average of 9.5%, a difference of 33.6%.
Male Disability Correlation Summary
| Measurement | Irish | Immigrants from China |
| Minimum | 2.4% | 3.2% |
| Maximum | 89.8% | 36.8% |
| Range | 87.4% | 33.5% |
| Mean | 19.1% | 10.0% |
| Median | 13.1% | 8.6% |
| Interquartile 25% (IQ1) | 12.0% | 8.0% |
| Interquartile 75% (IQ3) | 21.6% | 9.6% |
| Interquartile Range (IQR) | 9.5% | 1.6% |
| Standard Deviation (Sample) | 13.6% | 5.5% |
| Standard Deviation (Population) | 13.5% | 5.4% |
Similar Demographics by Male Disability
Demographics Similar to Irish by Male Disability
In terms of male disability, the demographic groups most similar to Irish are German (12.7%, a difference of 0.010%), Sioux (12.7%, a difference of 0.060%), Dutch (12.7%, a difference of 0.11%), Slovak (12.7%, a difference of 0.16%), and Spanish (12.7%, a difference of 0.28%).
| Demographics | Rating | Rank | Male Disability |
| Fijians | 0.0 /100 | #275 | Tragic 12.6% |
| Africans | 0.0 /100 | #276 | Tragic 12.6% |
| Finns | 0.0 /100 | #277 | Tragic 12.6% |
| Central American Indians | 0.0 /100 | #278 | Tragic 12.7% |
| Slovaks | 0.0 /100 | #279 | Tragic 12.7% |
| Dutch | 0.0 /100 | #280 | Tragic 12.7% |
| Sioux | 0.0 /100 | #281 | Tragic 12.7% |
| Irish | 0.0 /100 | #282 | Tragic 12.7% |
| Germans | 0.0 /100 | #283 | Tragic 12.7% |
| Spanish | 0.0 /100 | #284 | Tragic 12.7% |
| Welsh | 0.0 /100 | #285 | Tragic 12.7% |
| Scottish | 0.0 /100 | #286 | Tragic 12.8% |
| Cape Verdeans | 0.0 /100 | #287 | Tragic 12.8% |
| Yup'ik | 0.0 /100 | #288 | Tragic 12.8% |
| Immigrants | Cabo Verde | 0.0 /100 | #289 | Tragic 12.8% |
Demographics Similar to Immigrants from China by Male Disability
In terms of male disability, the demographic groups most similar to Immigrants from China are Immigrants from Singapore (9.5%, a difference of 0.080%), Immigrants from Israel (9.6%, a difference of 0.51%), Immigrants from Bolivia (9.5%, a difference of 0.60%), Immigrants from South Central Asia (9.4%, a difference of 0.93%), and Immigrants from Hong Kong (9.4%, a difference of 0.99%).
| Demographics | Rating | Rank | Male Disability |
| Immigrants | India | 100.0 /100 | #1 | Exceptional 9.0% |
| Immigrants | Taiwan | 100.0 /100 | #2 | Exceptional 9.1% |
| Filipinos | 100.0 /100 | #3 | Exceptional 9.1% |
| Thais | 100.0 /100 | #4 | Exceptional 9.2% |
| Immigrants | Hong Kong | 100.0 /100 | #5 | Exceptional 9.4% |
| Immigrants | South Central Asia | 100.0 /100 | #6 | Exceptional 9.4% |
| Immigrants | Bolivia | 100.0 /100 | #7 | Exceptional 9.5% |
| Immigrants | China | 100.0 /100 | #8 | Exceptional 9.5% |
| Immigrants | Singapore | 100.0 /100 | #9 | Exceptional 9.5% |
| Immigrants | Israel | 100.0 /100 | #10 | Exceptional 9.6% |
| Immigrants | Eastern Asia | 100.0 /100 | #11 | Exceptional 9.6% |
| Bolivians | 100.0 /100 | #12 | Exceptional 9.6% |
| Iranians | 100.0 /100 | #13 | Exceptional 9.7% |
| Immigrants | Iran | 100.0 /100 | #14 | Exceptional 9.7% |
| Indians (Asian) | 100.0 /100 | #15 | Exceptional 9.7% |