Immigrants from Bosnia and Herzegovina vs Immigrants from China Male Disability
COMPARE
Immigrants from Bosnia and Herzegovina
Immigrants from China
Male Disability
Male Disability Comparison
Immigrants from Bosnia and Herzegovina
Immigrants from China
11.4%
MALE DISABILITY
25.4/ 100
METRIC RATING
190th/ 347
METRIC RANK
9.5%
MALE DISABILITY
100.0/ 100
METRIC RATING
8th/ 347
METRIC RANK
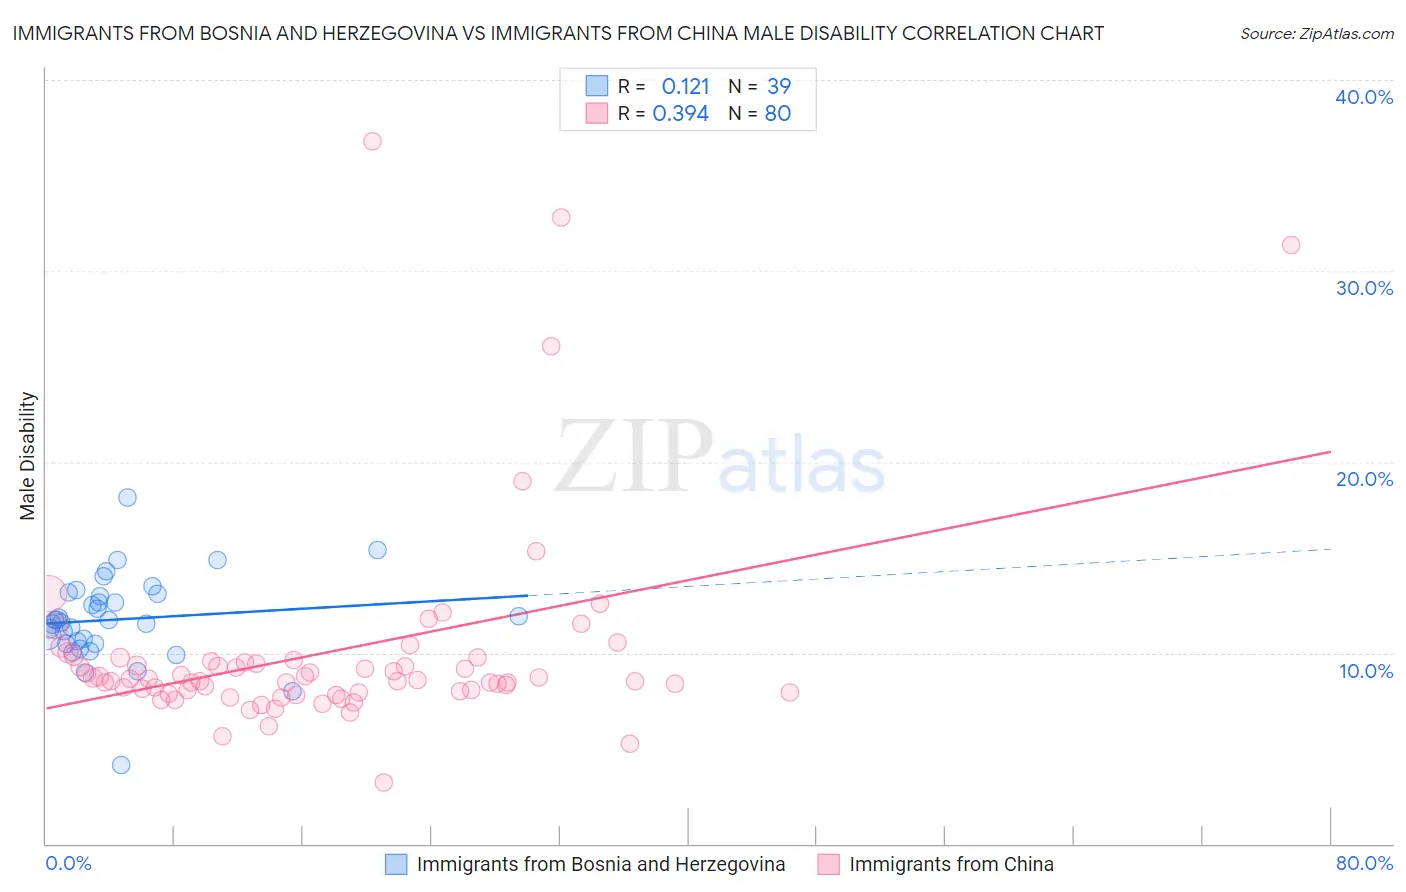
Immigrants from Bosnia and Herzegovina vs Immigrants from China Male Disability Correlation Chart
The statistical analysis conducted on geographies consisting of 156,819,568 people shows a poor positive correlation between the proportion of Immigrants from Bosnia and Herzegovina and percentage of males with a disability in the United States with a correlation coefficient (R) of 0.121 and weighted average of 11.4%. Similarly, the statistical analysis conducted on geographies consisting of 457,000,034 people shows a mild positive correlation between the proportion of Immigrants from China and percentage of males with a disability in the United States with a correlation coefficient (R) of 0.394 and weighted average of 9.5%, a difference of 19.6%.
Male Disability Correlation Summary
| Measurement | Immigrants from Bosnia and Herzegovina | Immigrants from China |
| Minimum | 4.1% | 3.2% |
| Maximum | 18.2% | 36.8% |
| Range | 14.1% | 33.5% |
| Mean | 11.8% | 10.0% |
| Median | 11.7% | 8.6% |
| Interquartile 25% (IQ1) | 10.5% | 8.0% |
| Interquartile 75% (IQ3) | 13.1% | 9.6% |
| Interquartile Range (IQR) | 2.6% | 1.6% |
| Standard Deviation (Sample) | 2.3% | 5.5% |
| Standard Deviation (Population) | 2.3% | 5.4% |
Similar Demographics by Male Disability
Demographics Similar to Immigrants from Bosnia and Herzegovina by Male Disability
In terms of male disability, the demographic groups most similar to Immigrants from Bosnia and Herzegovina are Immigrants from Netherlands (11.4%, a difference of 0.040%), Estonian (11.4%, a difference of 0.10%), Immigrants from Austria (11.4%, a difference of 0.14%), Immigrants from Zaire (11.4%, a difference of 0.16%), and Senegalese (11.4%, a difference of 0.16%).
| Demographics | Rating | Rank | Male Disability |
| Immigrants | Central America | 32.9 /100 | #183 | Fair 11.3% |
| Iraqis | 30.5 /100 | #184 | Fair 11.3% |
| Pakistanis | 30.3 /100 | #185 | Fair 11.3% |
| Immigrants | Zaire | 27.6 /100 | #186 | Fair 11.4% |
| Immigrants | Austria | 27.3 /100 | #187 | Fair 11.4% |
| Estonians | 26.8 /100 | #188 | Fair 11.4% |
| Immigrants | Netherlands | 25.9 /100 | #189 | Fair 11.4% |
| Immigrants | Bosnia and Herzegovina | 25.4 /100 | #190 | Fair 11.4% |
| Senegalese | 23.2 /100 | #191 | Fair 11.4% |
| Assyrians/Chaldeans/Syriacs | 23.2 /100 | #192 | Fair 11.4% |
| Greeks | 22.2 /100 | #193 | Fair 11.4% |
| Belizeans | 21.2 /100 | #194 | Fair 11.4% |
| Immigrants | Oceania | 20.9 /100 | #195 | Fair 11.4% |
| West Indians | 18.4 /100 | #196 | Poor 11.4% |
| Somalis | 18.2 /100 | #197 | Poor 11.4% |
Demographics Similar to Immigrants from China by Male Disability
In terms of male disability, the demographic groups most similar to Immigrants from China are Immigrants from Singapore (9.5%, a difference of 0.080%), Immigrants from Israel (9.6%, a difference of 0.51%), Immigrants from Bolivia (9.5%, a difference of 0.60%), Immigrants from South Central Asia (9.4%, a difference of 0.93%), and Immigrants from Hong Kong (9.4%, a difference of 0.99%).
| Demographics | Rating | Rank | Male Disability |
| Immigrants | India | 100.0 /100 | #1 | Exceptional 9.0% |
| Immigrants | Taiwan | 100.0 /100 | #2 | Exceptional 9.1% |
| Filipinos | 100.0 /100 | #3 | Exceptional 9.1% |
| Thais | 100.0 /100 | #4 | Exceptional 9.2% |
| Immigrants | Hong Kong | 100.0 /100 | #5 | Exceptional 9.4% |
| Immigrants | South Central Asia | 100.0 /100 | #6 | Exceptional 9.4% |
| Immigrants | Bolivia | 100.0 /100 | #7 | Exceptional 9.5% |
| Immigrants | China | 100.0 /100 | #8 | Exceptional 9.5% |
| Immigrants | Singapore | 100.0 /100 | #9 | Exceptional 9.5% |
| Immigrants | Israel | 100.0 /100 | #10 | Exceptional 9.6% |
| Immigrants | Eastern Asia | 100.0 /100 | #11 | Exceptional 9.6% |
| Bolivians | 100.0 /100 | #12 | Exceptional 9.6% |
| Iranians | 100.0 /100 | #13 | Exceptional 9.7% |
| Immigrants | Iran | 100.0 /100 | #14 | Exceptional 9.7% |
| Indians (Asian) | 100.0 /100 | #15 | Exceptional 9.7% |