Honduran vs Immigrants from China Male Disability
COMPARE
Honduran
Immigrants from China
Male Disability
Male Disability Comparison
Hondurans
Immigrants from China
11.3%
MALE DISABILITY
41.1/ 100
METRIC RATING
180th/ 347
METRIC RANK
9.5%
MALE DISABILITY
100.0/ 100
METRIC RATING
8th/ 347
METRIC RANK
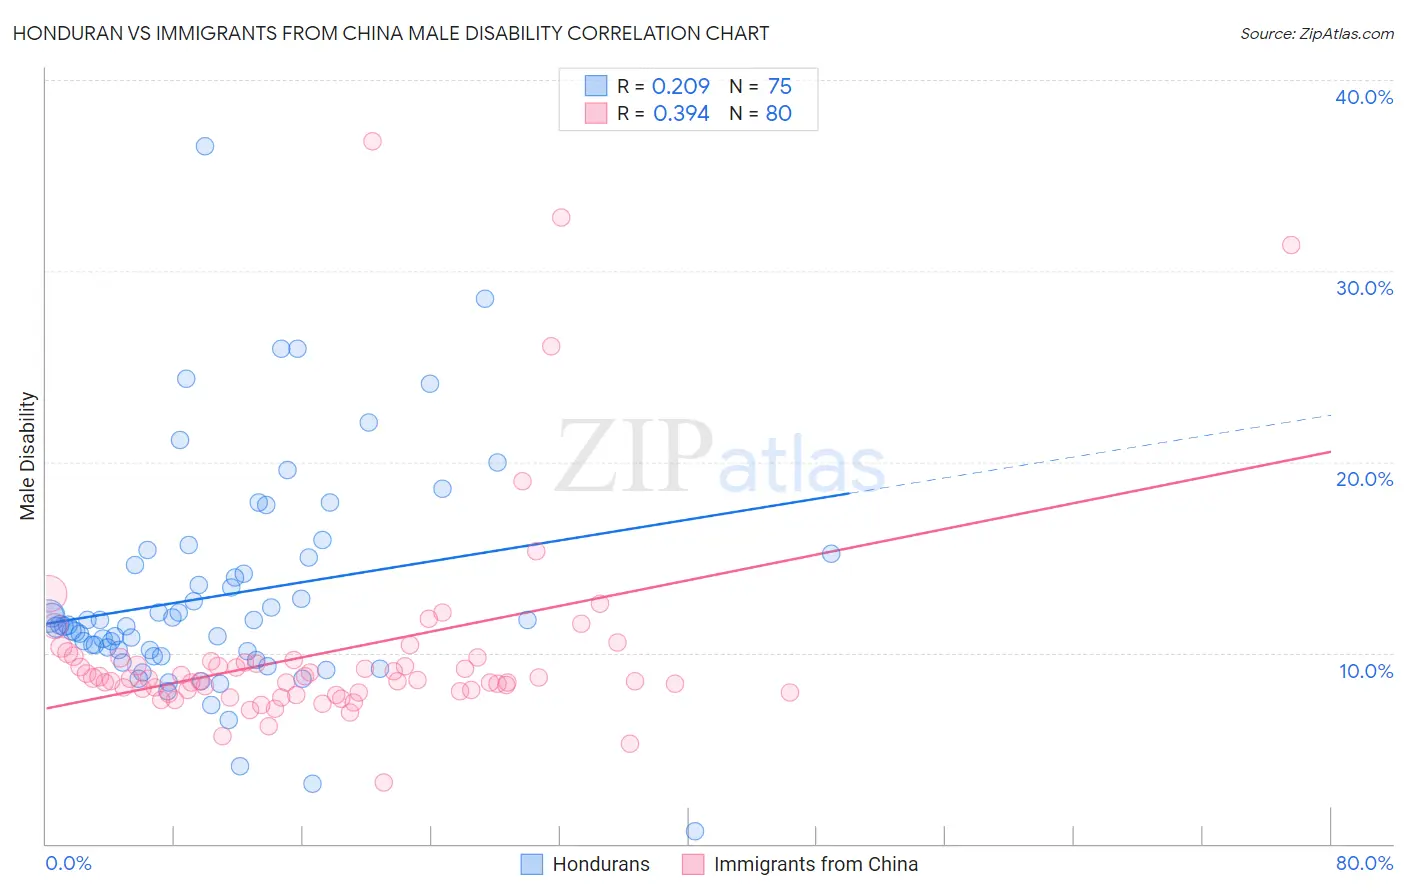
Honduran vs Immigrants from China Male Disability Correlation Chart
The statistical analysis conducted on geographies consisting of 357,765,878 people shows a weak positive correlation between the proportion of Hondurans and percentage of males with a disability in the United States with a correlation coefficient (R) of 0.209 and weighted average of 11.3%. Similarly, the statistical analysis conducted on geographies consisting of 457,000,034 people shows a mild positive correlation between the proportion of Immigrants from China and percentage of males with a disability in the United States with a correlation coefficient (R) of 0.394 and weighted average of 9.5%, a difference of 18.4%.
Male Disability Correlation Summary
| Measurement | Honduran | Immigrants from China |
| Minimum | 0.65% | 3.2% |
| Maximum | 36.5% | 36.8% |
| Range | 35.9% | 33.5% |
| Mean | 13.0% | 10.0% |
| Median | 11.4% | 8.6% |
| Interquartile 25% (IQ1) | 9.8% | 8.0% |
| Interquartile 75% (IQ3) | 15.0% | 9.6% |
| Interquartile Range (IQR) | 5.1% | 1.6% |
| Standard Deviation (Sample) | 5.8% | 5.5% |
| Standard Deviation (Population) | 5.8% | 5.4% |
Similar Demographics by Male Disability
Demographics Similar to Hondurans by Male Disability
In terms of male disability, the demographic groups most similar to Hondurans are Immigrants from Caribbean (11.3%, a difference of 0.020%), Australian (11.3%, a difference of 0.060%), Immigrants from Norway (11.3%, a difference of 0.17%), Syrian (11.2%, a difference of 0.31%), and Immigrants from Senegal (11.3%, a difference of 0.40%).
| Demographics | Rating | Rank | Male Disability |
| Immigrants | Burma/Myanmar | 50.4 /100 | #173 | Average 11.2% |
| Maltese | 50.0 /100 | #174 | Average 11.2% |
| Immigrants | Honduras | 48.7 /100 | #175 | Average 11.2% |
| Syrians | 46.6 /100 | #176 | Average 11.2% |
| Immigrants | Norway | 44.2 /100 | #177 | Average 11.3% |
| Australians | 42.2 /100 | #178 | Average 11.3% |
| Immigrants | Caribbean | 41.4 /100 | #179 | Average 11.3% |
| Hondurans | 41.1 /100 | #180 | Average 11.3% |
| Immigrants | Senegal | 34.4 /100 | #181 | Fair 11.3% |
| Immigrants | Belize | 33.7 /100 | #182 | Fair 11.3% |
| Immigrants | Central America | 32.9 /100 | #183 | Fair 11.3% |
| Iraqis | 30.5 /100 | #184 | Fair 11.3% |
| Pakistanis | 30.3 /100 | #185 | Fair 11.3% |
| Immigrants | Zaire | 27.6 /100 | #186 | Fair 11.4% |
| Immigrants | Austria | 27.3 /100 | #187 | Fair 11.4% |
Demographics Similar to Immigrants from China by Male Disability
In terms of male disability, the demographic groups most similar to Immigrants from China are Immigrants from Singapore (9.5%, a difference of 0.080%), Immigrants from Israel (9.6%, a difference of 0.51%), Immigrants from Bolivia (9.5%, a difference of 0.60%), Immigrants from South Central Asia (9.4%, a difference of 0.93%), and Immigrants from Hong Kong (9.4%, a difference of 0.99%).
| Demographics | Rating | Rank | Male Disability |
| Immigrants | India | 100.0 /100 | #1 | Exceptional 9.0% |
| Immigrants | Taiwan | 100.0 /100 | #2 | Exceptional 9.1% |
| Filipinos | 100.0 /100 | #3 | Exceptional 9.1% |
| Thais | 100.0 /100 | #4 | Exceptional 9.2% |
| Immigrants | Hong Kong | 100.0 /100 | #5 | Exceptional 9.4% |
| Immigrants | South Central Asia | 100.0 /100 | #6 | Exceptional 9.4% |
| Immigrants | Bolivia | 100.0 /100 | #7 | Exceptional 9.5% |
| Immigrants | China | 100.0 /100 | #8 | Exceptional 9.5% |
| Immigrants | Singapore | 100.0 /100 | #9 | Exceptional 9.5% |
| Immigrants | Israel | 100.0 /100 | #10 | Exceptional 9.6% |
| Immigrants | Eastern Asia | 100.0 /100 | #11 | Exceptional 9.6% |
| Bolivians | 100.0 /100 | #12 | Exceptional 9.6% |
| Iranians | 100.0 /100 | #13 | Exceptional 9.7% |
| Immigrants | Iran | 100.0 /100 | #14 | Exceptional 9.7% |
| Indians (Asian) | 100.0 /100 | #15 | Exceptional 9.7% |