Immigrants from Sri Lanka vs Immigrants from China Male Disability
COMPARE
Immigrants from Sri Lanka
Immigrants from China
Male Disability
Male Disability Comparison
Immigrants from Sri Lanka
Immigrants from China
10.0%
MALE DISABILITY
100.0/ 100
METRIC RATING
19th/ 347
METRIC RANK
9.5%
MALE DISABILITY
100.0/ 100
METRIC RATING
8th/ 347
METRIC RANK
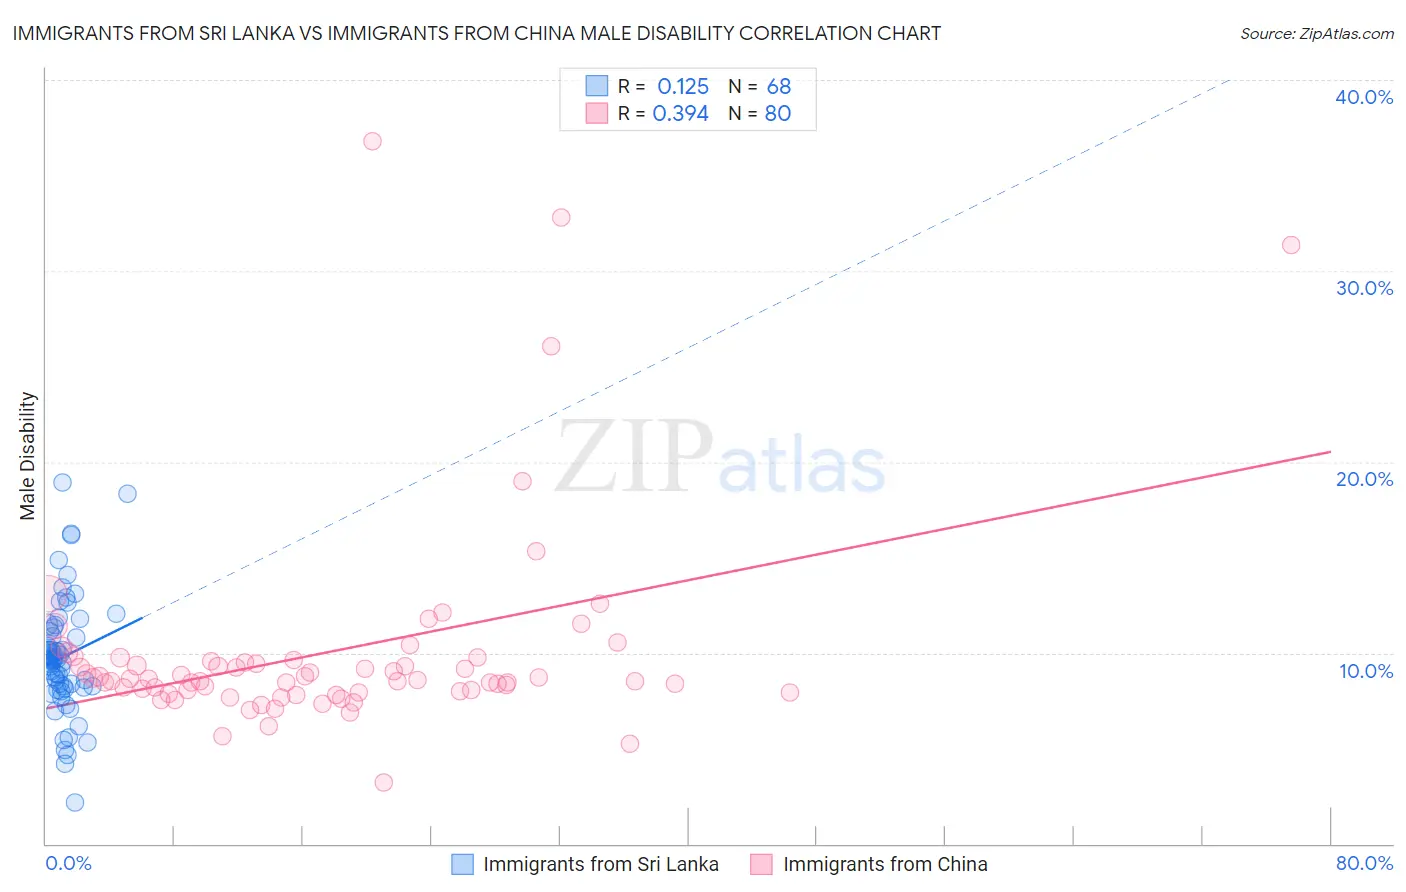
Immigrants from Sri Lanka vs Immigrants from China Male Disability Correlation Chart
The statistical analysis conducted on geographies consisting of 149,698,030 people shows a poor positive correlation between the proportion of Immigrants from Sri Lanka and percentage of males with a disability in the United States with a correlation coefficient (R) of 0.125 and weighted average of 10.0%. Similarly, the statistical analysis conducted on geographies consisting of 457,000,034 people shows a mild positive correlation between the proportion of Immigrants from China and percentage of males with a disability in the United States with a correlation coefficient (R) of 0.394 and weighted average of 9.5%, a difference of 4.6%.
Male Disability Correlation Summary
| Measurement | Immigrants from Sri Lanka | Immigrants from China |
| Minimum | 2.1% | 3.2% |
| Maximum | 18.9% | 36.8% |
| Range | 16.8% | 33.5% |
| Mean | 9.8% | 10.0% |
| Median | 9.7% | 8.6% |
| Interquartile 25% (IQ1) | 8.2% | 8.0% |
| Interquartile 75% (IQ3) | 11.2% | 9.6% |
| Interquartile Range (IQR) | 3.0% | 1.6% |
| Standard Deviation (Sample) | 3.1% | 5.5% |
| Standard Deviation (Population) | 3.0% | 5.4% |
Demographics Similar to Immigrants from Sri Lanka and Immigrants from China by Male Disability
In terms of male disability, the demographic groups most similar to Immigrants from Sri Lanka are Asian (10.0%, a difference of 0.060%), Burmese (10.0%, a difference of 0.16%), Immigrants from Venezuela (10.0%, a difference of 0.45%), Cypriot (10.0%, a difference of 0.54%), and Immigrants from Pakistan (9.8%, a difference of 1.2%). Similarly, the demographic groups most similar to Immigrants from China are Immigrants from Singapore (9.5%, a difference of 0.080%), Immigrants from Israel (9.6%, a difference of 0.51%), Immigrants from Bolivia (9.5%, a difference of 0.60%), Immigrants from South Central Asia (9.4%, a difference of 0.93%), and Immigrants from Hong Kong (9.4%, a difference of 0.99%).
| Demographics | Rating | Rank | Male Disability |
| Filipinos | 100.0 /100 | #3 | Exceptional 9.1% |
| Thais | 100.0 /100 | #4 | Exceptional 9.2% |
| Immigrants | Hong Kong | 100.0 /100 | #5 | Exceptional 9.4% |
| Immigrants | South Central Asia | 100.0 /100 | #6 | Exceptional 9.4% |
| Immigrants | Bolivia | 100.0 /100 | #7 | Exceptional 9.5% |
| Immigrants | China | 100.0 /100 | #8 | Exceptional 9.5% |
| Immigrants | Singapore | 100.0 /100 | #9 | Exceptional 9.5% |
| Immigrants | Israel | 100.0 /100 | #10 | Exceptional 9.6% |
| Immigrants | Eastern Asia | 100.0 /100 | #11 | Exceptional 9.6% |
| Bolivians | 100.0 /100 | #12 | Exceptional 9.6% |
| Iranians | 100.0 /100 | #13 | Exceptional 9.7% |
| Immigrants | Iran | 100.0 /100 | #14 | Exceptional 9.7% |
| Indians (Asian) | 100.0 /100 | #15 | Exceptional 9.7% |
| Okinawans | 100.0 /100 | #16 | Exceptional 9.8% |
| Immigrants | Korea | 100.0 /100 | #17 | Exceptional 9.8% |
| Immigrants | Pakistan | 100.0 /100 | #18 | Exceptional 9.8% |
| Immigrants | Sri Lanka | 100.0 /100 | #19 | Exceptional 10.0% |
| Asians | 100.0 /100 | #20 | Exceptional 10.0% |
| Burmese | 100.0 /100 | #21 | Exceptional 10.0% |
| Immigrants | Venezuela | 100.0 /100 | #22 | Exceptional 10.0% |
| Cypriots | 100.0 /100 | #23 | Exceptional 10.0% |