Mongolian vs Immigrants from Kuwait Ambulatory Disability
COMPARE
Mongolian
Immigrants from Kuwait
Ambulatory Disability
Ambulatory Disability Comparison
Mongolians
Immigrants from Kuwait
5.5%
AMBULATORY DISABILITY
99.9/ 100
METRIC RATING
41st/ 347
METRIC RANK
5.4%
AMBULATORY DISABILITY
100.0/ 100
METRIC RATING
21st/ 347
METRIC RANK
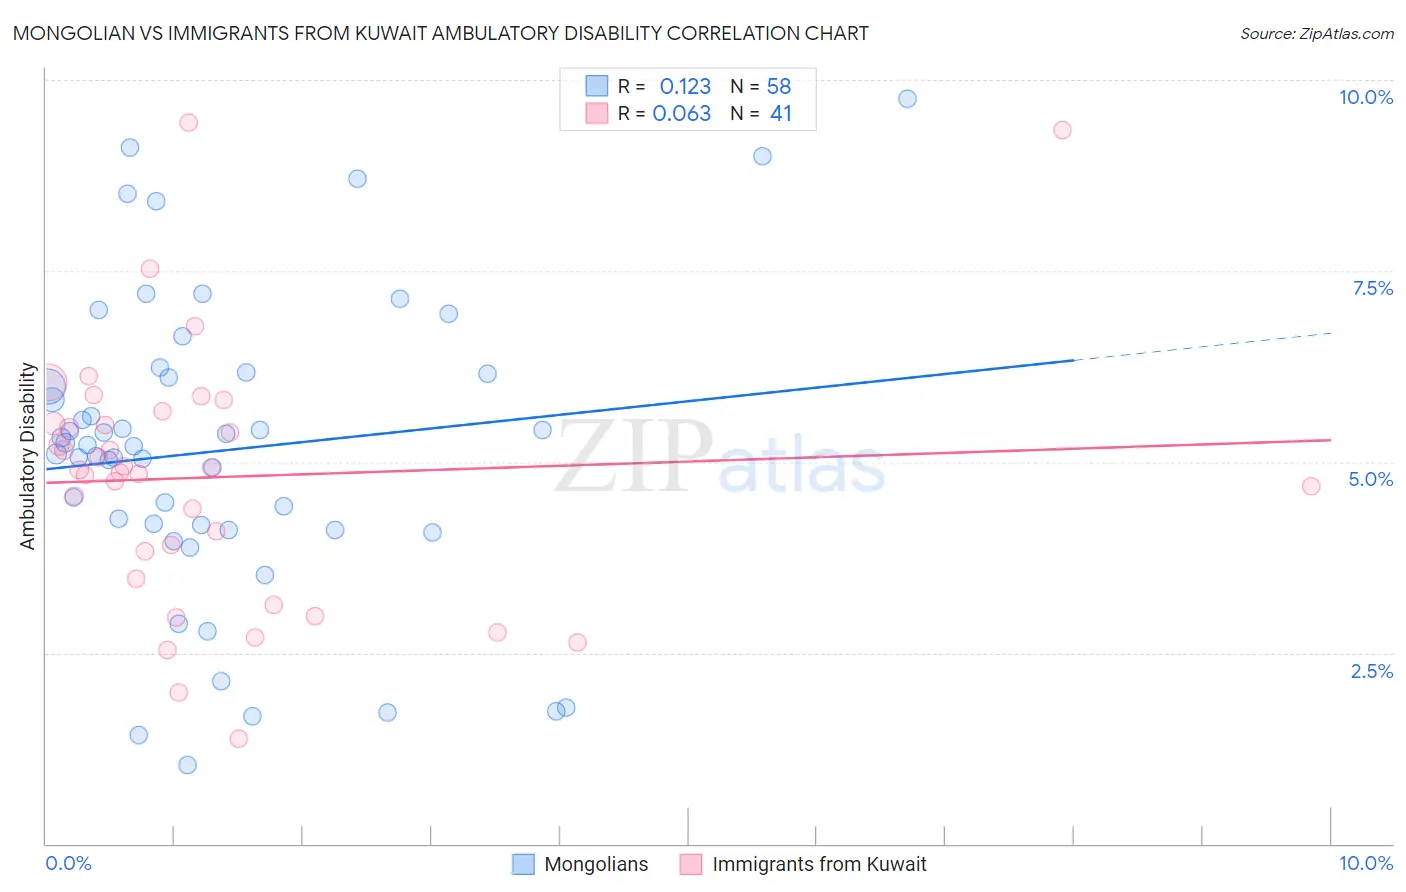
Mongolian vs Immigrants from Kuwait Ambulatory Disability Correlation Chart
The statistical analysis conducted on geographies consisting of 140,347,726 people shows a poor positive correlation between the proportion of Mongolians and percentage of population with ambulatory disability in the United States with a correlation coefficient (R) of 0.123 and weighted average of 5.5%. Similarly, the statistical analysis conducted on geographies consisting of 136,900,049 people shows a slight positive correlation between the proportion of Immigrants from Kuwait and percentage of population with ambulatory disability in the United States with a correlation coefficient (R) of 0.063 and weighted average of 5.4%, a difference of 2.7%.
Ambulatory Disability Correlation Summary
| Measurement | Mongolian | Immigrants from Kuwait |
| Minimum | 1.0% | 1.4% |
| Maximum | 9.8% | 9.4% |
| Range | 8.7% | 8.1% |
| Mean | 5.2% | 4.8% |
| Median | 5.2% | 4.9% |
| Interquartile 25% (IQ1) | 4.1% | 3.6% |
| Interquartile 75% (IQ3) | 6.1% | 5.6% |
| Interquartile Range (IQR) | 2.0% | 1.9% |
| Standard Deviation (Sample) | 2.0% | 1.7% |
| Standard Deviation (Population) | 2.0% | 1.7% |
Demographics Similar to Mongolians and Immigrants from Kuwait by Ambulatory Disability
In terms of ambulatory disability, the demographic groups most similar to Mongolians are Venezuelan (5.5%, a difference of 0.080%), Immigrants from Eritrea (5.5%, a difference of 0.42%), Turkish (5.5%, a difference of 0.51%), Cypriot (5.5%, a difference of 0.51%), and Immigrants from Malaysia (5.5%, a difference of 0.53%). Similarly, the demographic groups most similar to Immigrants from Kuwait are Immigrants from Israel (5.4%, a difference of 0.37%), Tongan (5.4%, a difference of 0.41%), Immigrants from Saudi Arabia (5.4%, a difference of 0.50%), Zimbabwean (5.4%, a difference of 0.58%), and Immigrants from Nepal (5.4%, a difference of 0.61%).
| Demographics | Rating | Rank | Ambulatory Disability |
| Immigrants | Kuwait | 100.0 /100 | #21 | Exceptional 5.4% |
| Immigrants | Israel | 100.0 /100 | #22 | Exceptional 5.4% |
| Tongans | 100.0 /100 | #23 | Exceptional 5.4% |
| Immigrants | Saudi Arabia | 100.0 /100 | #24 | Exceptional 5.4% |
| Zimbabweans | 100.0 /100 | #25 | Exceptional 5.4% |
| Immigrants | Nepal | 100.0 /100 | #26 | Exceptional 5.4% |
| Asians | 100.0 /100 | #27 | Exceptional 5.4% |
| Cambodians | 100.0 /100 | #28 | Exceptional 5.4% |
| Immigrants | Iran | 100.0 /100 | #29 | Exceptional 5.4% |
| Immigrants | Turkey | 100.0 /100 | #30 | Exceptional 5.4% |
| Immigrants | Venezuela | 100.0 /100 | #31 | Exceptional 5.4% |
| Immigrants | Australia | 100.0 /100 | #32 | Exceptional 5.5% |
| Immigrants | Pakistan | 100.0 /100 | #33 | Exceptional 5.5% |
| Immigrants | Asia | 100.0 /100 | #34 | Exceptional 5.5% |
| Afghans | 100.0 /100 | #35 | Exceptional 5.5% |
| Immigrants | Malaysia | 100.0 /100 | #36 | Exceptional 5.5% |
| Turks | 100.0 /100 | #37 | Exceptional 5.5% |
| Cypriots | 100.0 /100 | #38 | Exceptional 5.5% |
| Immigrants | Eritrea | 100.0 /100 | #39 | Exceptional 5.5% |
| Venezuelans | 99.9 /100 | #40 | Exceptional 5.5% |
| Mongolians | 99.9 /100 | #41 | Exceptional 5.5% |