Mongolian vs Immigrants from South America Ambulatory Disability
COMPARE
Mongolian
Immigrants from South America
Ambulatory Disability
Ambulatory Disability Comparison
Mongolians
Immigrants from South America
5.5%
AMBULATORY DISABILITY
99.9/ 100
METRIC RATING
41st/ 347
METRIC RANK
5.8%
AMBULATORY DISABILITY
97.9/ 100
METRIC RATING
101st/ 347
METRIC RANK
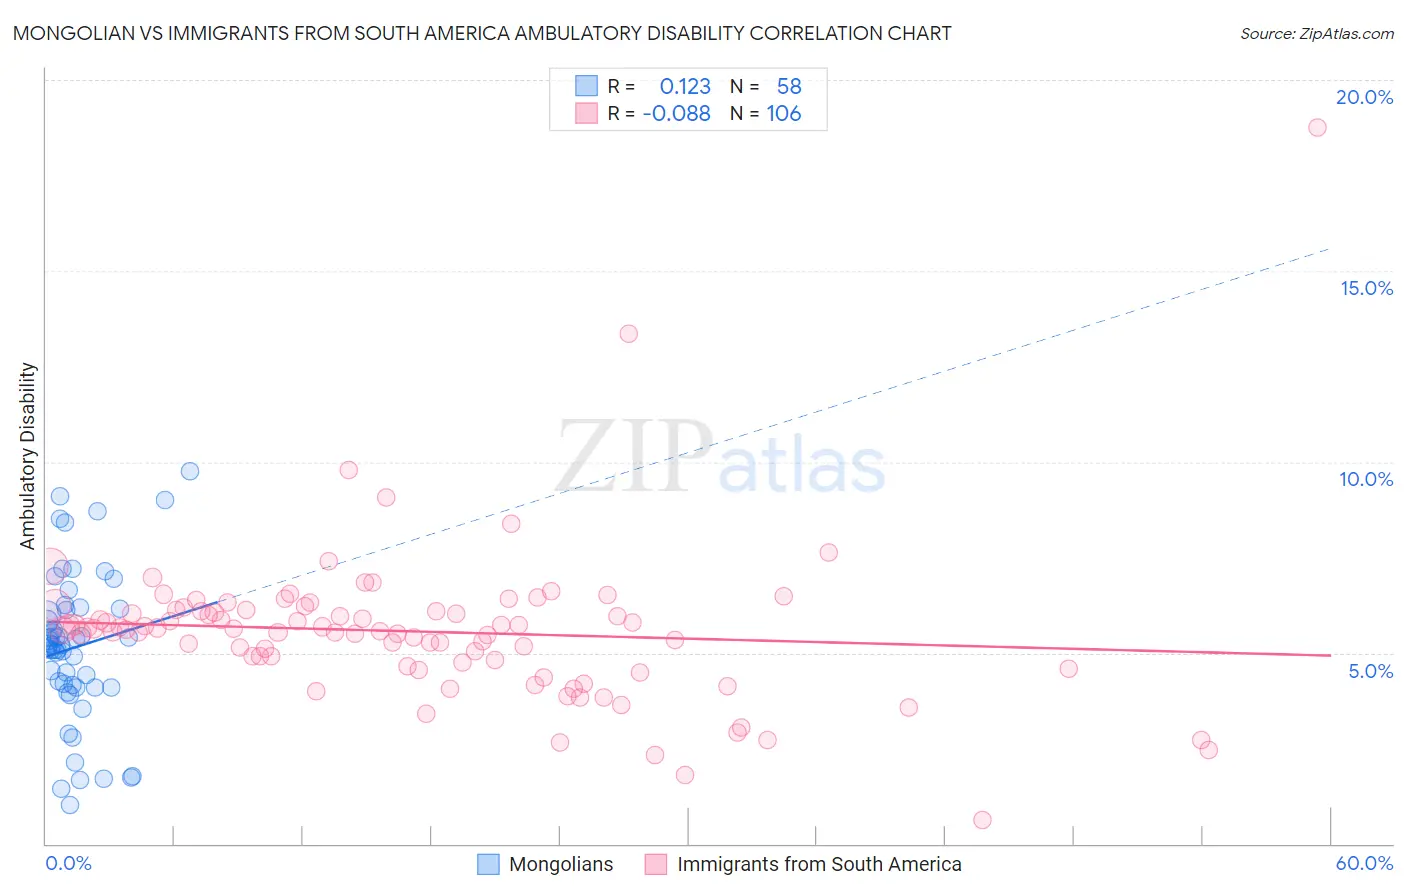
Mongolian vs Immigrants from South America Ambulatory Disability Correlation Chart
The statistical analysis conducted on geographies consisting of 140,347,726 people shows a poor positive correlation between the proportion of Mongolians and percentage of population with ambulatory disability in the United States with a correlation coefficient (R) of 0.123 and weighted average of 5.5%. Similarly, the statistical analysis conducted on geographies consisting of 486,161,675 people shows a slight negative correlation between the proportion of Immigrants from South America and percentage of population with ambulatory disability in the United States with a correlation coefficient (R) of -0.088 and weighted average of 5.8%, a difference of 5.4%.
Ambulatory Disability Correlation Summary
| Measurement | Mongolian | Immigrants from South America |
| Minimum | 1.0% | 0.63% |
| Maximum | 9.8% | 18.8% |
| Range | 8.7% | 18.1% |
| Mean | 5.2% | 5.6% |
| Median | 5.2% | 5.6% |
| Interquartile 25% (IQ1) | 4.1% | 4.7% |
| Interquartile 75% (IQ3) | 6.1% | 6.1% |
| Interquartile Range (IQR) | 2.0% | 1.4% |
| Standard Deviation (Sample) | 2.0% | 2.1% |
| Standard Deviation (Population) | 2.0% | 2.0% |
Similar Demographics by Ambulatory Disability
Demographics Similar to Mongolians by Ambulatory Disability
In terms of ambulatory disability, the demographic groups most similar to Mongolians are Venezuelan (5.5%, a difference of 0.080%), Argentinean (5.5%, a difference of 0.080%), Immigrants from Eritrea (5.5%, a difference of 0.42%), Turkish (5.5%, a difference of 0.51%), and Cypriot (5.5%, a difference of 0.51%).
| Demographics | Rating | Rank | Ambulatory Disability |
| Immigrants | Asia | 100.0 /100 | #34 | Exceptional 5.5% |
| Afghans | 100.0 /100 | #35 | Exceptional 5.5% |
| Immigrants | Malaysia | 100.0 /100 | #36 | Exceptional 5.5% |
| Turks | 100.0 /100 | #37 | Exceptional 5.5% |
| Cypriots | 100.0 /100 | #38 | Exceptional 5.5% |
| Immigrants | Eritrea | 100.0 /100 | #39 | Exceptional 5.5% |
| Venezuelans | 99.9 /100 | #40 | Exceptional 5.5% |
| Mongolians | 99.9 /100 | #41 | Exceptional 5.5% |
| Argentineans | 99.9 /100 | #42 | Exceptional 5.5% |
| Paraguayans | 99.9 /100 | #43 | Exceptional 5.5% |
| Immigrants | Indonesia | 99.9 /100 | #44 | Exceptional 5.5% |
| Immigrants | Sweden | 99.9 /100 | #45 | Exceptional 5.6% |
| Egyptians | 99.9 /100 | #46 | Exceptional 5.6% |
| Immigrants | Japan | 99.9 /100 | #47 | Exceptional 5.6% |
| Immigrants | Argentina | 99.9 /100 | #48 | Exceptional 5.6% |
Demographics Similar to Immigrants from South America by Ambulatory Disability
In terms of ambulatory disability, the demographic groups most similar to Immigrants from South America are Immigrants from Serbia (5.8%, a difference of 0.0%), Immigrants from Kenya (5.8%, a difference of 0.080%), Immigrants from Romania (5.8%, a difference of 0.15%), Immigrants from Northern Europe (5.8%, a difference of 0.19%), and New Zealander (5.8%, a difference of 0.21%).
| Demographics | Rating | Rank | Ambulatory Disability |
| Kenyans | 98.4 /100 | #94 | Exceptional 5.8% |
| Immigrants | El Salvador | 98.4 /100 | #95 | Exceptional 5.8% |
| Salvadorans | 98.4 /100 | #96 | Exceptional 5.8% |
| Immigrants | Somalia | 98.3 /100 | #97 | Exceptional 5.8% |
| Immigrants | Lebanon | 98.3 /100 | #98 | Exceptional 5.8% |
| Immigrants | Northern Europe | 98.2 /100 | #99 | Exceptional 5.8% |
| Immigrants | Serbia | 97.9 /100 | #100 | Exceptional 5.8% |
| Immigrants | South America | 97.9 /100 | #101 | Exceptional 5.8% |
| Immigrants | Kenya | 97.8 /100 | #102 | Exceptional 5.8% |
| Immigrants | Romania | 97.7 /100 | #103 | Exceptional 5.8% |
| New Zealanders | 97.6 /100 | #104 | Exceptional 5.8% |
| Immigrants | Czechoslovakia | 97.4 /100 | #105 | Exceptional 5.8% |
| Immigrants | Morocco | 97.3 /100 | #106 | Exceptional 5.8% |
| Uruguayans | 97.2 /100 | #107 | Exceptional 5.8% |
| Colombians | 97.2 /100 | #108 | Exceptional 5.8% |