Mongolian vs Central American Ambulatory Disability
COMPARE
Mongolian
Central American
Ambulatory Disability
Ambulatory Disability Comparison
Mongolians
Central Americans
5.5%
AMBULATORY DISABILITY
99.9/ 100
METRIC RATING
41st/ 347
METRIC RANK
6.0%
AMBULATORY DISABILITY
69.8/ 100
METRIC RATING
160th/ 347
METRIC RANK
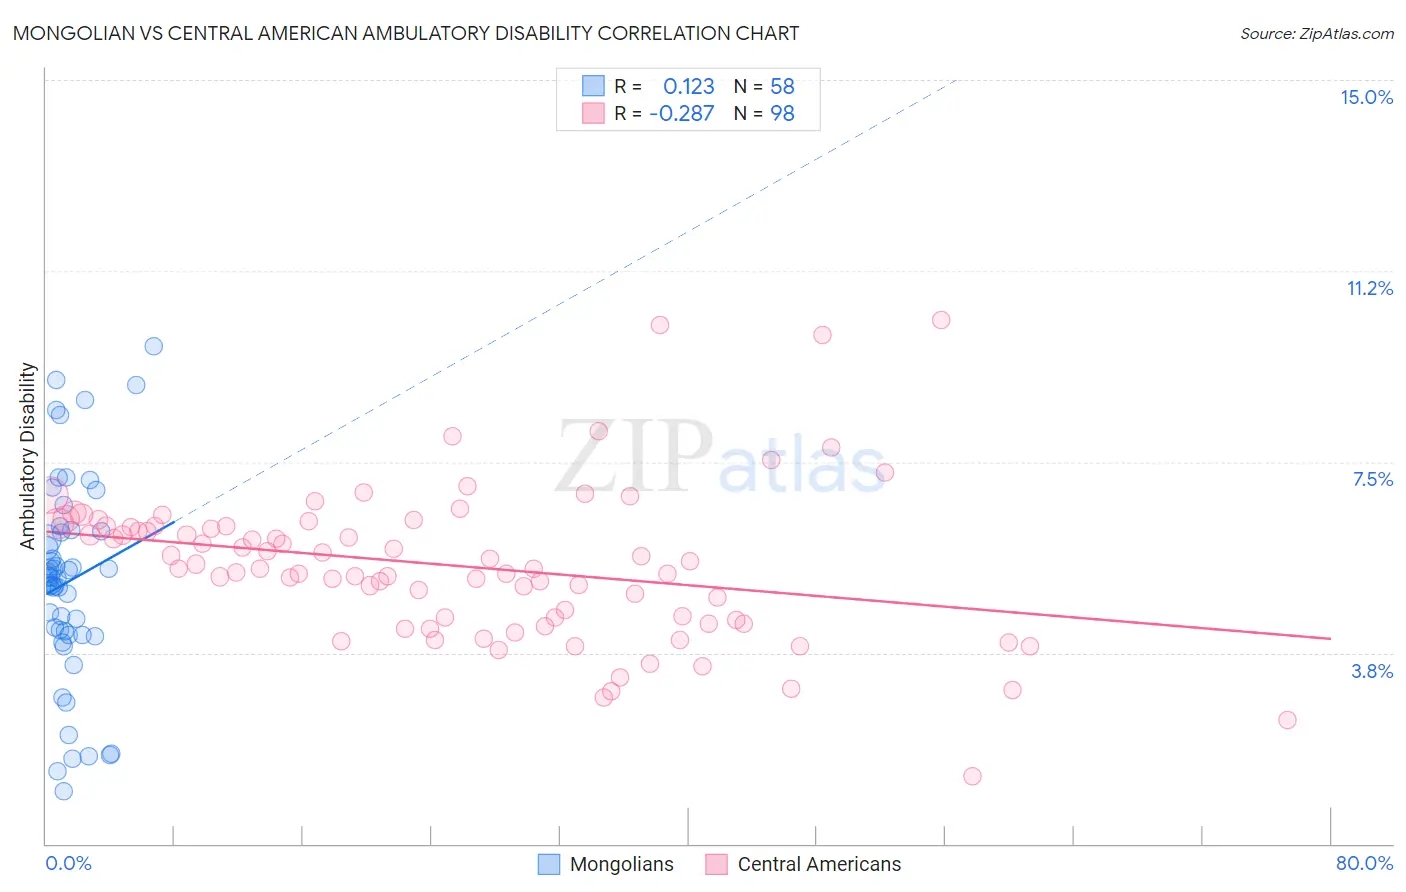
Mongolian vs Central American Ambulatory Disability Correlation Chart
The statistical analysis conducted on geographies consisting of 140,347,726 people shows a poor positive correlation between the proportion of Mongolians and percentage of population with ambulatory disability in the United States with a correlation coefficient (R) of 0.123 and weighted average of 5.5%. Similarly, the statistical analysis conducted on geographies consisting of 504,305,341 people shows a weak negative correlation between the proportion of Central Americans and percentage of population with ambulatory disability in the United States with a correlation coefficient (R) of -0.287 and weighted average of 6.0%, a difference of 9.9%.
Ambulatory Disability Correlation Summary
| Measurement | Mongolian | Central American |
| Minimum | 1.0% | 1.3% |
| Maximum | 9.8% | 10.3% |
| Range | 8.7% | 9.0% |
| Mean | 5.2% | 5.5% |
| Median | 5.2% | 5.4% |
| Interquartile 25% (IQ1) | 4.1% | 4.4% |
| Interquartile 75% (IQ3) | 6.1% | 6.2% |
| Interquartile Range (IQR) | 2.0% | 1.9% |
| Standard Deviation (Sample) | 2.0% | 1.5% |
| Standard Deviation (Population) | 2.0% | 1.5% |
Similar Demographics by Ambulatory Disability
Demographics Similar to Mongolians by Ambulatory Disability
In terms of ambulatory disability, the demographic groups most similar to Mongolians are Venezuelan (5.5%, a difference of 0.080%), Argentinean (5.5%, a difference of 0.080%), Immigrants from Eritrea (5.5%, a difference of 0.42%), Turkish (5.5%, a difference of 0.51%), and Cypriot (5.5%, a difference of 0.51%).
| Demographics | Rating | Rank | Ambulatory Disability |
| Immigrants | Asia | 100.0 /100 | #34 | Exceptional 5.5% |
| Afghans | 100.0 /100 | #35 | Exceptional 5.5% |
| Immigrants | Malaysia | 100.0 /100 | #36 | Exceptional 5.5% |
| Turks | 100.0 /100 | #37 | Exceptional 5.5% |
| Cypriots | 100.0 /100 | #38 | Exceptional 5.5% |
| Immigrants | Eritrea | 100.0 /100 | #39 | Exceptional 5.5% |
| Venezuelans | 99.9 /100 | #40 | Exceptional 5.5% |
| Mongolians | 99.9 /100 | #41 | Exceptional 5.5% |
| Argentineans | 99.9 /100 | #42 | Exceptional 5.5% |
| Paraguayans | 99.9 /100 | #43 | Exceptional 5.5% |
| Immigrants | Indonesia | 99.9 /100 | #44 | Exceptional 5.5% |
| Immigrants | Sweden | 99.9 /100 | #45 | Exceptional 5.6% |
| Egyptians | 99.9 /100 | #46 | Exceptional 5.6% |
| Immigrants | Japan | 99.9 /100 | #47 | Exceptional 5.6% |
| Immigrants | Argentina | 99.9 /100 | #48 | Exceptional 5.6% |
Demographics Similar to Central Americans by Ambulatory Disability
In terms of ambulatory disability, the demographic groups most similar to Central Americans are Immigrants from Belarus (6.1%, a difference of 0.040%), Immigrants from Fiji (6.0%, a difference of 0.080%), Immigrants from Latvia (6.0%, a difference of 0.080%), Ghanaian (6.0%, a difference of 0.10%), and Northern European (6.0%, a difference of 0.13%).
| Demographics | Rating | Rank | Ambulatory Disability |
| Syrians | 75.5 /100 | #153 | Good 6.0% |
| Immigrants | Croatia | 75.1 /100 | #154 | Good 6.0% |
| Immigrants | Scotland | 72.1 /100 | #155 | Good 6.0% |
| Northern Europeans | 71.8 /100 | #156 | Good 6.0% |
| Ghanaians | 71.3 /100 | #157 | Good 6.0% |
| Immigrants | Fiji | 71.2 /100 | #158 | Good 6.0% |
| Immigrants | Latvia | 71.1 /100 | #159 | Good 6.0% |
| Central Americans | 69.8 /100 | #160 | Good 6.0% |
| Immigrants | Belarus | 69.2 /100 | #161 | Good 6.1% |
| Nigerians | 67.1 /100 | #162 | Good 6.1% |
| Lebanese | 66.2 /100 | #163 | Good 6.1% |
| Basques | 63.7 /100 | #164 | Good 6.1% |
| Nicaraguans | 63.2 /100 | #165 | Good 6.1% |
| Iraqis | 62.8 /100 | #166 | Good 6.1% |
| Immigrants | Oceania | 60.7 /100 | #167 | Good 6.1% |