Mongolian vs Chickasaw Householder Income Ages 45 - 64 years
COMPARE
Mongolian
Chickasaw
Householder Income Ages 45 - 64 years
Householder Income Ages 45 - 64 years Comparison
Mongolians
Chickasaw
$111,602
HOUSEHOLDER INCOME AGES 45 - 64 YEARS
99.6/ 100
METRIC RATING
63rd/ 347
METRIC RANK
$82,193
HOUSEHOLDER INCOME AGES 45 - 64 YEARS
0.0/ 100
METRIC RATING
319th/ 347
METRIC RANK
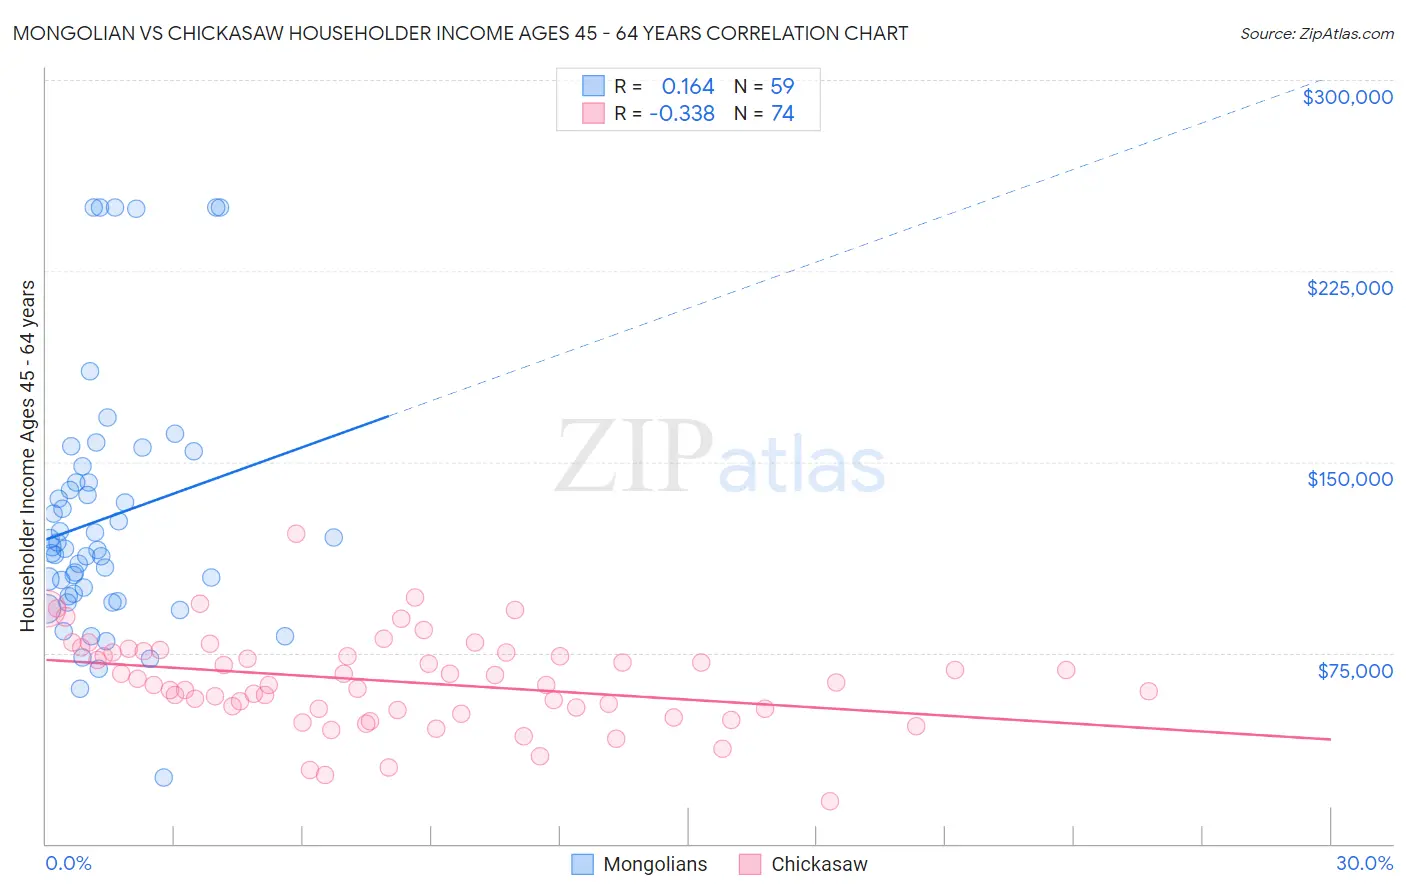
Mongolian vs Chickasaw Householder Income Ages 45 - 64 years Correlation Chart
The statistical analysis conducted on geographies consisting of 140,216,470 people shows a poor positive correlation between the proportion of Mongolians and household income with householder between the ages 45 and 64 in the United States with a correlation coefficient (R) of 0.164 and weighted average of $111,602. Similarly, the statistical analysis conducted on geographies consisting of 147,555,811 people shows a mild negative correlation between the proportion of Chickasaw and household income with householder between the ages 45 and 64 in the United States with a correlation coefficient (R) of -0.338 and weighted average of $82,193, a difference of 35.8%.
Householder Income Ages 45 - 64 years Correlation Summary
| Measurement | Mongolian | Chickasaw |
| Minimum | $25,952 | $16,544 |
| Maximum | $250,001 | $121,667 |
| Range | $224,049 | $105,123 |
| Mean | $127,849 | $63,806 |
| Median | $115,953 | $62,897 |
| Interquartile 25% (IQ1) | $97,273 | $52,874 |
| Interquartile 75% (IQ3) | $142,123 | $75,000 |
| Interquartile Range (IQR) | $44,850 | $22,126 |
| Standard Deviation (Sample) | $50,162 | $18,170 |
| Standard Deviation (Population) | $49,735 | $18,046 |
Similar Demographics by Householder Income Ages 45 - 64 years
Demographics Similar to Mongolians by Householder Income Ages 45 - 64 years
In terms of householder income ages 45 - 64 years, the demographic groups most similar to Mongolians are Immigrants from Norway ($111,669, a difference of 0.060%), Immigrants from Latvia ($111,454, a difference of 0.13%), Immigrants from Belarus ($111,430, a difference of 0.15%), Immigrants from Czechoslovakia ($111,914, a difference of 0.28%), and New Zealander ($111,286, a difference of 0.28%).
| Demographics | Rating | Rank | Householder Income Ages 45 - 64 years |
| Egyptians | 99.7 /100 | #56 | Exceptional $112,256 |
| Immigrants | Scotland | 99.7 /100 | #57 | Exceptional $112,175 |
| Soviet Union | 99.7 /100 | #58 | Exceptional $112,008 |
| Immigrants | Europe | 99.7 /100 | #59 | Exceptional $111,984 |
| Immigrants | Netherlands | 99.7 /100 | #60 | Exceptional $111,982 |
| Immigrants | Czechoslovakia | 99.7 /100 | #61 | Exceptional $111,914 |
| Immigrants | Norway | 99.7 /100 | #62 | Exceptional $111,669 |
| Mongolians | 99.6 /100 | #63 | Exceptional $111,602 |
| Immigrants | Latvia | 99.6 /100 | #64 | Exceptional $111,454 |
| Immigrants | Belarus | 99.6 /100 | #65 | Exceptional $111,430 |
| New Zealanders | 99.6 /100 | #66 | Exceptional $111,286 |
| Laotians | 99.5 /100 | #67 | Exceptional $111,051 |
| Immigrants | Romania | 99.4 /100 | #68 | Exceptional $110,633 |
| Immigrants | Italy | 99.4 /100 | #69 | Exceptional $110,434 |
| Koreans | 99.3 /100 | #70 | Exceptional $110,334 |
Demographics Similar to Chickasaw by Householder Income Ages 45 - 64 years
In terms of householder income ages 45 - 64 years, the demographic groups most similar to Chickasaw are Apache ($82,184, a difference of 0.010%), Yuman ($82,139, a difference of 0.070%), Choctaw ($82,287, a difference of 0.11%), Colville ($82,474, a difference of 0.34%), and Immigrants from Caribbean ($82,513, a difference of 0.39%).
| Demographics | Rating | Rank | Householder Income Ages 45 - 64 years |
| Cajuns | 0.0 /100 | #312 | Tragic $83,015 |
| U.S. Virgin Islanders | 0.0 /100 | #313 | Tragic $82,736 |
| Immigrants | Honduras | 0.0 /100 | #314 | Tragic $82,697 |
| Paiute | 0.0 /100 | #315 | Tragic $82,629 |
| Immigrants | Caribbean | 0.0 /100 | #316 | Tragic $82,513 |
| Colville | 0.0 /100 | #317 | Tragic $82,474 |
| Choctaw | 0.0 /100 | #318 | Tragic $82,287 |
| Chickasaw | 0.0 /100 | #319 | Tragic $82,193 |
| Apache | 0.0 /100 | #320 | Tragic $82,184 |
| Yuman | 0.0 /100 | #321 | Tragic $82,139 |
| Sioux | 0.0 /100 | #322 | Tragic $81,750 |
| Bahamians | 0.0 /100 | #323 | Tragic $81,369 |
| Yup'ik | 0.0 /100 | #324 | Tragic $81,000 |
| Immigrants | Cuba | 0.0 /100 | #325 | Tragic $80,662 |
| Dominicans | 0.0 /100 | #326 | Tragic $80,623 |