Yuman vs Polish Disability Age 5 to 17
COMPARE
Yuman
Polish
Disability Age 5 to 17
Disability Age 5 to 17 Comparison
Yuman
Poles
5.4%
DISABILITY AGE 5 TO 17
92.3/ 100
METRIC RATING
134th/ 347
METRIC RANK
5.9%
DISABILITY AGE 5 TO 17
1.5/ 100
METRIC RATING
250th/ 347
METRIC RANK
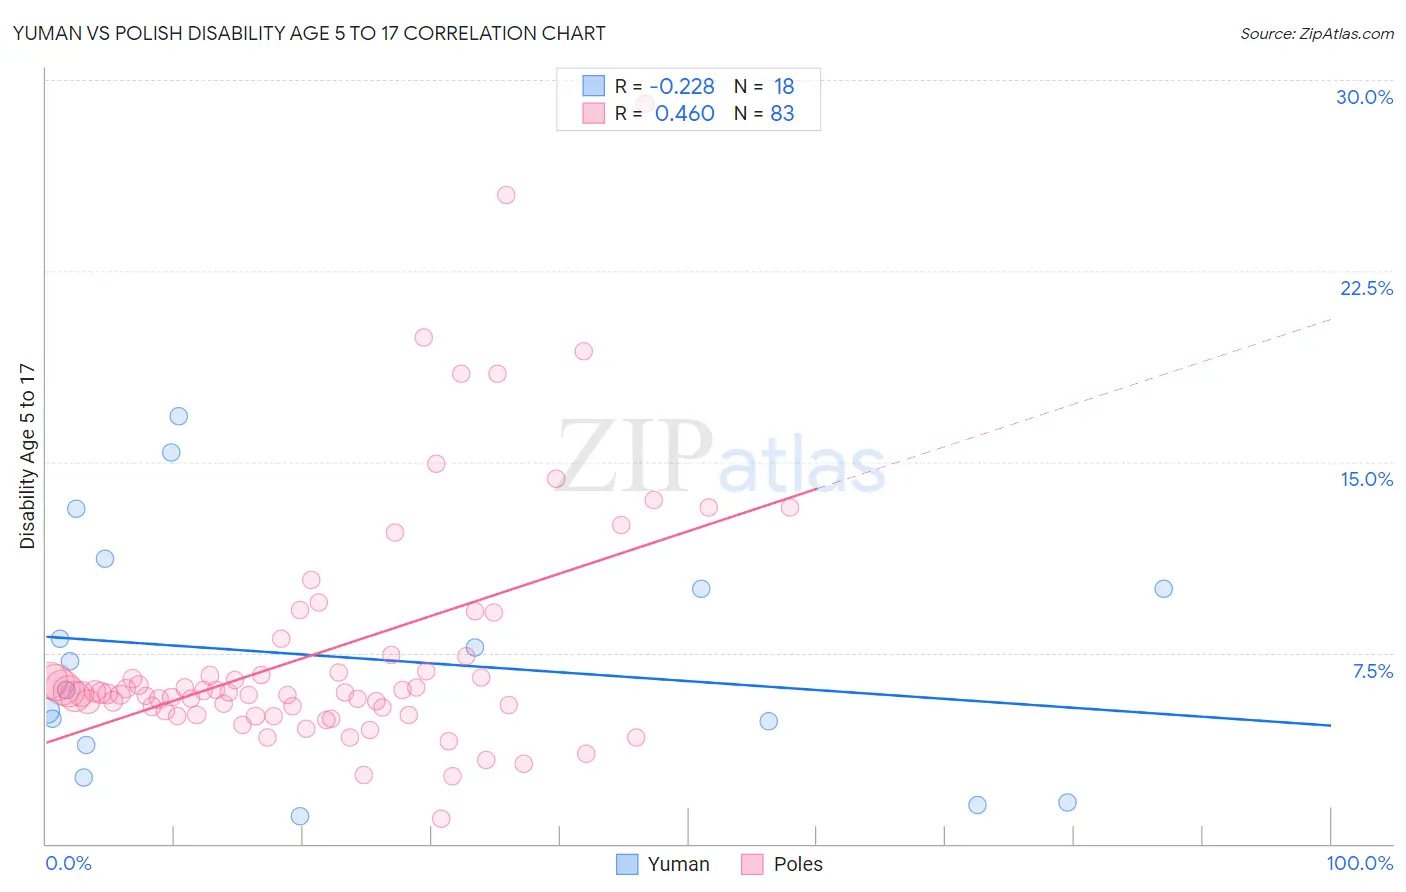
Yuman vs Polish Disability Age 5 to 17 Correlation Chart
The statistical analysis conducted on geographies consisting of 40,599,925 people shows a weak negative correlation between the proportion of Yuman and percentage of population with a disability between the ages 5 and 17 in the United States with a correlation coefficient (R) of -0.228 and weighted average of 5.4%. Similarly, the statistical analysis conducted on geographies consisting of 547,751,801 people shows a moderate positive correlation between the proportion of Poles and percentage of population with a disability between the ages 5 and 17 in the United States with a correlation coefficient (R) of 0.460 and weighted average of 5.9%, a difference of 8.5%.
Disability Age 5 to 17 Correlation Summary
| Measurement | Yuman | Polish |
| Minimum | 1.1% | 0.99% |
| Maximum | 16.8% | 29.1% |
| Range | 15.7% | 28.1% |
| Mean | 7.3% | 7.5% |
| Median | 6.6% | 5.9% |
| Interquartile 25% (IQ1) | 3.9% | 5.2% |
| Interquartile 75% (IQ3) | 10.0% | 7.4% |
| Interquartile Range (IQR) | 6.1% | 2.2% |
| Standard Deviation (Sample) | 4.7% | 4.9% |
| Standard Deviation (Population) | 4.6% | 4.9% |
Similar Demographics by Disability Age 5 to 17
Demographics Similar to Yuman by Disability Age 5 to 17
In terms of disability age 5 to 17, the demographic groups most similar to Yuman are Venezuelan (5.4%, a difference of 0.080%), Immigrants from Belize (5.4%, a difference of 0.10%), Immigrants from Colombia (5.4%, a difference of 0.11%), Arab (5.4%, a difference of 0.13%), and Immigrants from Denmark (5.4%, a difference of 0.15%).
| Demographics | Rating | Rank | Disability Age 5 to 17 |
| Latvians | 95.0 /100 | #127 | Exceptional 5.4% |
| Immigrants | Venezuela | 94.5 /100 | #128 | Exceptional 5.4% |
| Romanians | 94.1 /100 | #129 | Exceptional 5.4% |
| Immigrants | Bulgaria | 94.0 /100 | #130 | Exceptional 5.4% |
| Arabs | 92.9 /100 | #131 | Exceptional 5.4% |
| Immigrants | Colombia | 92.9 /100 | #132 | Exceptional 5.4% |
| Venezuelans | 92.7 /100 | #133 | Exceptional 5.4% |
| Yuman | 92.3 /100 | #134 | Exceptional 5.4% |
| Immigrants | Belize | 91.7 /100 | #135 | Exceptional 5.4% |
| Immigrants | Denmark | 91.4 /100 | #136 | Exceptional 5.4% |
| Navajo | 90.9 /100 | #137 | Exceptional 5.4% |
| Immigrants | Oceania | 90.8 /100 | #138 | Exceptional 5.4% |
| Belizeans | 90.8 /100 | #139 | Exceptional 5.4% |
| Immigrants | Netherlands | 90.5 /100 | #140 | Exceptional 5.4% |
| South American Indians | 89.3 /100 | #141 | Excellent 5.5% |
Demographics Similar to Poles by Disability Age 5 to 17
In terms of disability age 5 to 17, the demographic groups most similar to Poles are Immigrants from Cambodia (5.9%, a difference of 0.020%), Honduran (5.9%, a difference of 0.040%), Scandinavian (5.9%, a difference of 0.11%), Immigrants from Ghana (5.9%, a difference of 0.12%), and British (5.9%, a difference of 0.13%).
| Demographics | Rating | Rank | Disability Age 5 to 17 |
| Indonesians | 2.0 /100 | #243 | Tragic 5.9% |
| Immigrants | Germany | 1.9 /100 | #244 | Tragic 5.9% |
| Immigrants | Micronesia | 1.9 /100 | #245 | Tragic 5.9% |
| Tlingit-Haida | 1.9 /100 | #246 | Tragic 5.9% |
| Immigrants | Honduras | 1.8 /100 | #247 | Tragic 5.9% |
| British | 1.7 /100 | #248 | Tragic 5.9% |
| Immigrants | Ghana | 1.7 /100 | #249 | Tragic 5.9% |
| Poles | 1.5 /100 | #250 | Tragic 5.9% |
| Immigrants | Cambodia | 1.5 /100 | #251 | Tragic 5.9% |
| Hondurans | 1.5 /100 | #252 | Tragic 5.9% |
| Scandinavians | 1.4 /100 | #253 | Tragic 5.9% |
| Barbadians | 1.3 /100 | #254 | Tragic 5.9% |
| Italians | 1.2 /100 | #255 | Tragic 5.9% |
| Hopi | 1.0 /100 | #256 | Tragic 5.9% |
| Hispanics or Latinos | 1.0 /100 | #257 | Tragic 5.9% |