Dominican vs Polish Disability Age 5 to 17
COMPARE
Dominican
Polish
Disability Age 5 to 17
Disability Age 5 to 17 Comparison
Dominicans
Poles
6.5%
DISABILITY AGE 5 TO 17
0.0/ 100
METRIC RATING
324th/ 347
METRIC RANK
5.9%
DISABILITY AGE 5 TO 17
1.5/ 100
METRIC RATING
250th/ 347
METRIC RANK
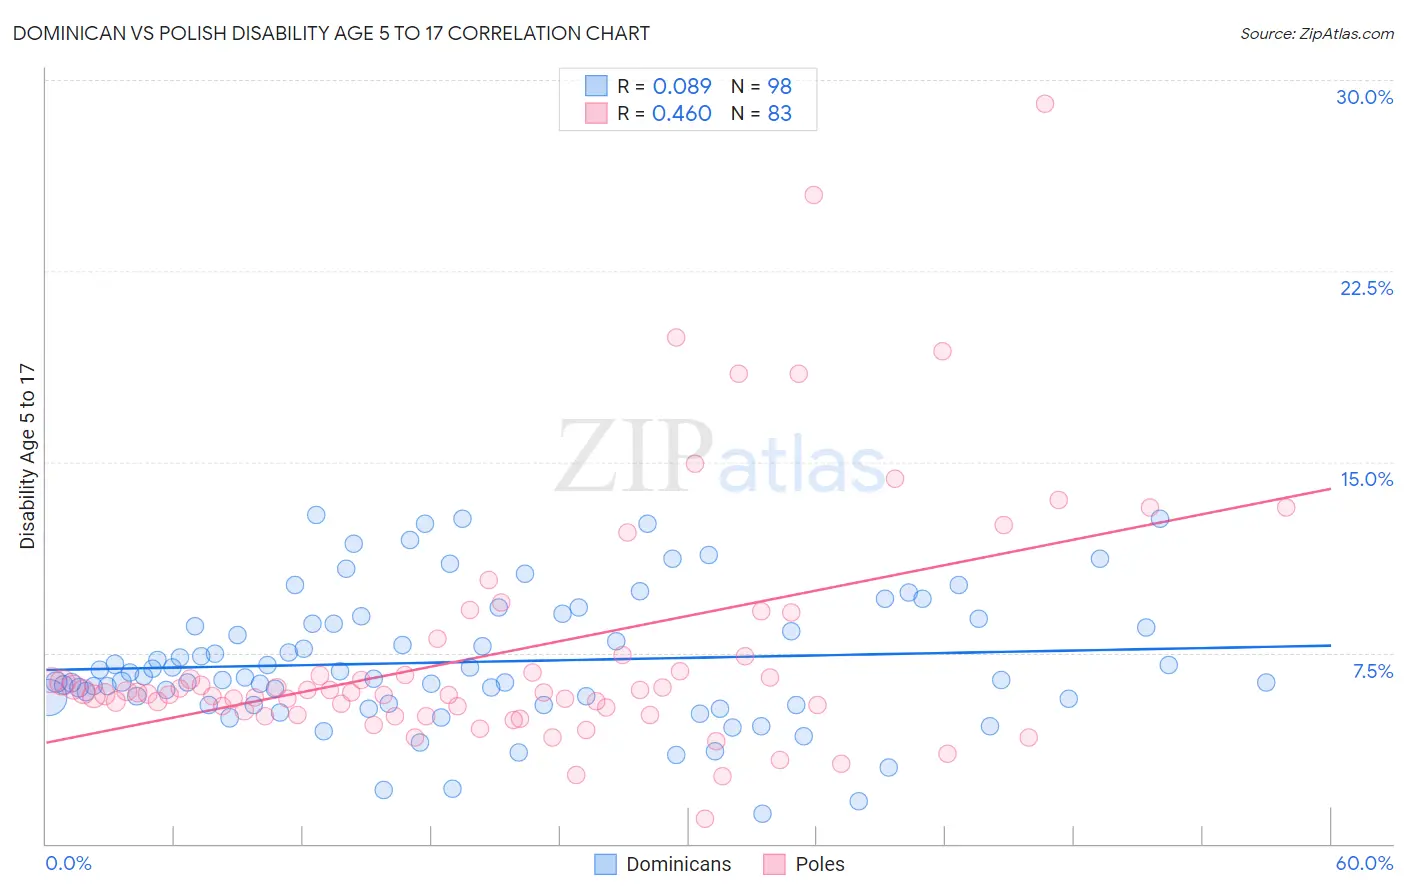
Dominican vs Polish Disability Age 5 to 17 Correlation Chart
The statistical analysis conducted on geographies consisting of 352,404,408 people shows a slight positive correlation between the proportion of Dominicans and percentage of population with a disability between the ages 5 and 17 in the United States with a correlation coefficient (R) of 0.089 and weighted average of 6.5%. Similarly, the statistical analysis conducted on geographies consisting of 547,751,801 people shows a moderate positive correlation between the proportion of Poles and percentage of population with a disability between the ages 5 and 17 in the United States with a correlation coefficient (R) of 0.460 and weighted average of 5.9%, a difference of 10.8%.
Disability Age 5 to 17 Correlation Summary
| Measurement | Dominican | Polish |
| Minimum | 1.2% | 0.99% |
| Maximum | 12.9% | 29.1% |
| Range | 11.7% | 28.1% |
| Mean | 7.1% | 7.5% |
| Median | 6.5% | 5.9% |
| Interquartile 25% (IQ1) | 5.5% | 5.2% |
| Interquartile 75% (IQ3) | 8.7% | 7.4% |
| Interquartile Range (IQR) | 3.1% | 2.2% |
| Standard Deviation (Sample) | 2.6% | 4.9% |
| Standard Deviation (Population) | 2.6% | 4.9% |
Similar Demographics by Disability Age 5 to 17
Demographics Similar to Dominicans by Disability Age 5 to 17
In terms of disability age 5 to 17, the demographic groups most similar to Dominicans are American (6.5%, a difference of 0.050%), Osage (6.5%, a difference of 0.080%), Slovak (6.5%, a difference of 0.12%), Tohono O'odham (6.5%, a difference of 0.14%), and Potawatomi (6.5%, a difference of 0.19%).
| Demographics | Rating | Rank | Disability Age 5 to 17 |
| Kiowa | 0.0 /100 | #317 | Tragic 6.4% |
| Comanche | 0.0 /100 | #318 | Tragic 6.4% |
| Delaware | 0.0 /100 | #319 | Tragic 6.5% |
| Africans | 0.0 /100 | #320 | Tragic 6.5% |
| Tohono O'odham | 0.0 /100 | #321 | Tragic 6.5% |
| Slovaks | 0.0 /100 | #322 | Tragic 6.5% |
| Osage | 0.0 /100 | #323 | Tragic 6.5% |
| Dominicans | 0.0 /100 | #324 | Tragic 6.5% |
| Americans | 0.0 /100 | #325 | Tragic 6.5% |
| Potawatomi | 0.0 /100 | #326 | Tragic 6.5% |
| French American Indians | 0.0 /100 | #327 | Tragic 6.6% |
| Pennsylvania Germans | 0.0 /100 | #328 | Tragic 6.6% |
| Blackfeet | 0.0 /100 | #329 | Tragic 6.6% |
| Dutch West Indians | 0.0 /100 | #330 | Tragic 6.7% |
| French Canadians | 0.0 /100 | #331 | Tragic 6.7% |
Demographics Similar to Poles by Disability Age 5 to 17
In terms of disability age 5 to 17, the demographic groups most similar to Poles are Immigrants from Cambodia (5.9%, a difference of 0.020%), Honduran (5.9%, a difference of 0.040%), Scandinavian (5.9%, a difference of 0.11%), Immigrants from Ghana (5.9%, a difference of 0.12%), and British (5.9%, a difference of 0.13%).
| Demographics | Rating | Rank | Disability Age 5 to 17 |
| Indonesians | 2.0 /100 | #243 | Tragic 5.9% |
| Immigrants | Germany | 1.9 /100 | #244 | Tragic 5.9% |
| Immigrants | Micronesia | 1.9 /100 | #245 | Tragic 5.9% |
| Tlingit-Haida | 1.9 /100 | #246 | Tragic 5.9% |
| Immigrants | Honduras | 1.8 /100 | #247 | Tragic 5.9% |
| British | 1.7 /100 | #248 | Tragic 5.9% |
| Immigrants | Ghana | 1.7 /100 | #249 | Tragic 5.9% |
| Poles | 1.5 /100 | #250 | Tragic 5.9% |
| Immigrants | Cambodia | 1.5 /100 | #251 | Tragic 5.9% |
| Hondurans | 1.5 /100 | #252 | Tragic 5.9% |
| Scandinavians | 1.4 /100 | #253 | Tragic 5.9% |
| Barbadians | 1.3 /100 | #254 | Tragic 5.9% |
| Italians | 1.2 /100 | #255 | Tragic 5.9% |
| Hopi | 1.0 /100 | #256 | Tragic 5.9% |
| Hispanics or Latinos | 1.0 /100 | #257 | Tragic 5.9% |