Nonimmigrants vs Polish Disability Age 5 to 17
COMPARE
Nonimmigrants
Polish
Disability Age 5 to 17
Disability Age 5 to 17 Comparison
Nonimmigrants
Poles
6.3%
DISABILITY AGE 5 TO 17
0.0/ 100
METRIC RATING
306th/ 347
METRIC RANK
5.9%
DISABILITY AGE 5 TO 17
1.5/ 100
METRIC RATING
250th/ 347
METRIC RANK
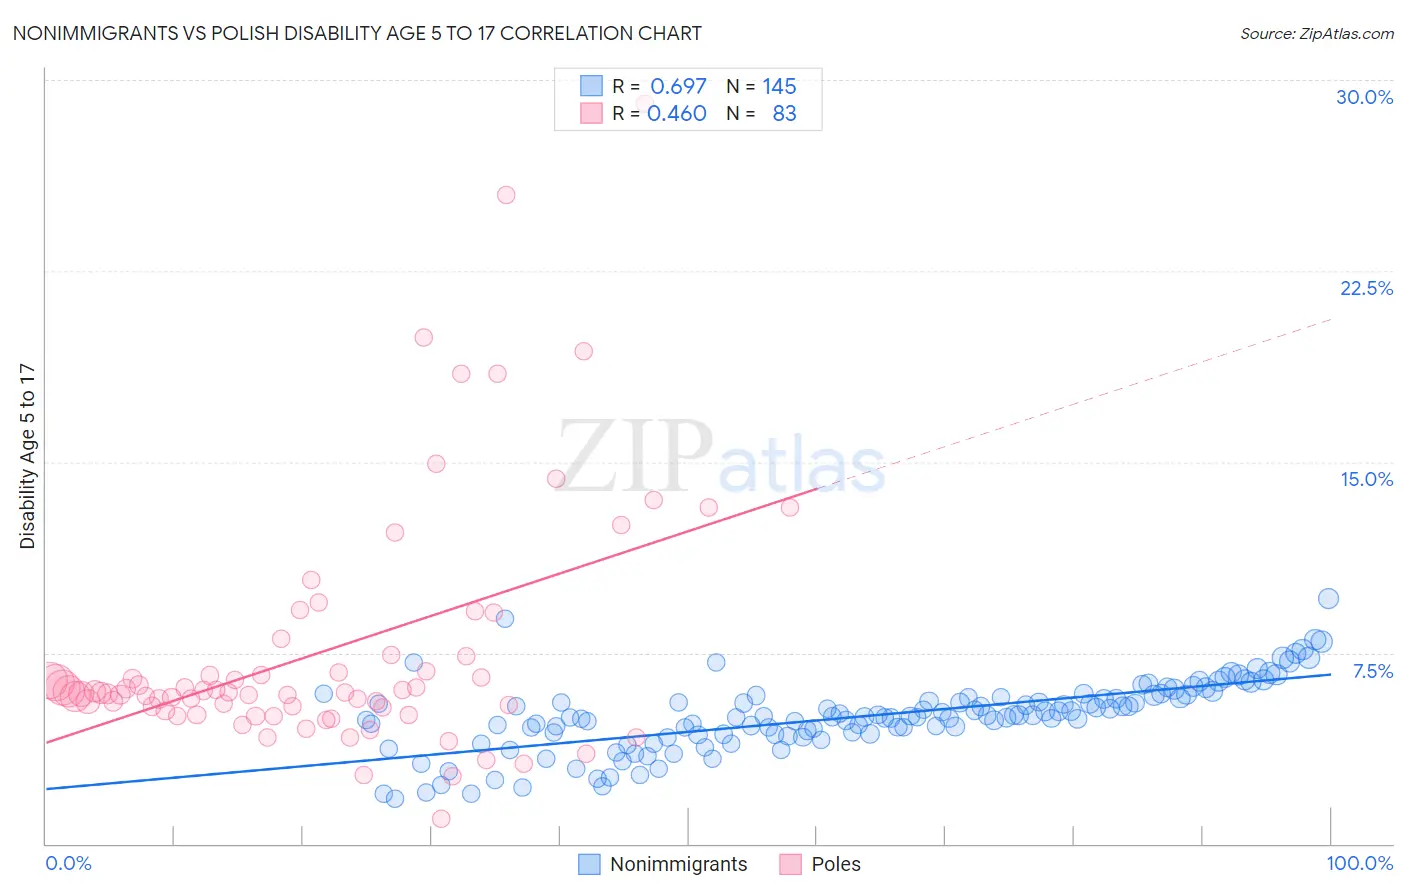
Nonimmigrants vs Polish Disability Age 5 to 17 Correlation Chart
The statistical analysis conducted on geographies consisting of 567,642,967 people shows a significant positive correlation between the proportion of Nonimmigrants and percentage of population with a disability between the ages 5 and 17 in the United States with a correlation coefficient (R) of 0.697 and weighted average of 6.3%. Similarly, the statistical analysis conducted on geographies consisting of 547,751,801 people shows a moderate positive correlation between the proportion of Poles and percentage of population with a disability between the ages 5 and 17 in the United States with a correlation coefficient (R) of 0.460 and weighted average of 5.9%, a difference of 7.2%.
Disability Age 5 to 17 Correlation Summary
| Measurement | Nonimmigrants | Polish |
| Minimum | 1.8% | 0.99% |
| Maximum | 9.6% | 29.1% |
| Range | 7.9% | 28.1% |
| Mean | 5.0% | 7.5% |
| Median | 5.0% | 5.9% |
| Interquartile 25% (IQ1) | 4.3% | 5.2% |
| Interquartile 75% (IQ3) | 5.7% | 7.4% |
| Interquartile Range (IQR) | 1.4% | 2.2% |
| Standard Deviation (Sample) | 1.4% | 4.9% |
| Standard Deviation (Population) | 1.4% | 4.9% |
Similar Demographics by Disability Age 5 to 17
Demographics Similar to Nonimmigrants by Disability Age 5 to 17
In terms of disability age 5 to 17, the demographic groups most similar to Nonimmigrants are Native/Alaskan (6.3%, a difference of 0.10%), Bahamian (6.3%, a difference of 0.14%), Senegalese (6.3%, a difference of 0.24%), Yakama (6.3%, a difference of 0.32%), and Scotch-Irish (6.3%, a difference of 0.37%).
| Demographics | Rating | Rank | Disability Age 5 to 17 |
| Welsh | 0.0 /100 | #299 | Tragic 6.3% |
| Carpatho Rusyns | 0.0 /100 | #300 | Tragic 6.3% |
| U.S. Virgin Islanders | 0.0 /100 | #301 | Tragic 6.3% |
| Celtics | 0.0 /100 | #302 | Tragic 6.3% |
| Yakama | 0.0 /100 | #303 | Tragic 6.3% |
| Senegalese | 0.0 /100 | #304 | Tragic 6.3% |
| Natives/Alaskans | 0.0 /100 | #305 | Tragic 6.3% |
| Immigrants | Nonimmigrants | 0.0 /100 | #306 | Tragic 6.3% |
| Bahamians | 0.0 /100 | #307 | Tragic 6.3% |
| Scotch-Irish | 0.0 /100 | #308 | Tragic 6.3% |
| Hmong | 0.0 /100 | #309 | Tragic 6.3% |
| Alaskan Athabascans | 0.0 /100 | #310 | Tragic 6.3% |
| Immigrants | Dominica | 0.0 /100 | #311 | Tragic 6.3% |
| Bermudans | 0.0 /100 | #312 | Tragic 6.4% |
| Apache | 0.0 /100 | #313 | Tragic 6.4% |
Demographics Similar to Poles by Disability Age 5 to 17
In terms of disability age 5 to 17, the demographic groups most similar to Poles are Immigrants from Cambodia (5.9%, a difference of 0.020%), Honduran (5.9%, a difference of 0.040%), Scandinavian (5.9%, a difference of 0.11%), Immigrants from Ghana (5.9%, a difference of 0.12%), and British (5.9%, a difference of 0.13%).
| Demographics | Rating | Rank | Disability Age 5 to 17 |
| Indonesians | 2.0 /100 | #243 | Tragic 5.9% |
| Immigrants | Germany | 1.9 /100 | #244 | Tragic 5.9% |
| Immigrants | Micronesia | 1.9 /100 | #245 | Tragic 5.9% |
| Tlingit-Haida | 1.9 /100 | #246 | Tragic 5.9% |
| Immigrants | Honduras | 1.8 /100 | #247 | Tragic 5.9% |
| British | 1.7 /100 | #248 | Tragic 5.9% |
| Immigrants | Ghana | 1.7 /100 | #249 | Tragic 5.9% |
| Poles | 1.5 /100 | #250 | Tragic 5.9% |
| Immigrants | Cambodia | 1.5 /100 | #251 | Tragic 5.9% |
| Hondurans | 1.5 /100 | #252 | Tragic 5.9% |
| Scandinavians | 1.4 /100 | #253 | Tragic 5.9% |
| Barbadians | 1.3 /100 | #254 | Tragic 5.9% |
| Italians | 1.2 /100 | #255 | Tragic 5.9% |
| Hopi | 1.0 /100 | #256 | Tragic 5.9% |
| Hispanics or Latinos | 1.0 /100 | #257 | Tragic 5.9% |