Mexican American Indian vs Polish 9th Grade
COMPARE
Mexican American Indian
Polish
9th Grade
9th Grade Comparison
Mexican American Indians
Poles
90.9%
9TH GRADE
0.0/ 100
METRIC RATING
331st/ 347
METRIC RANK
96.7%
9TH GRADE
100.0/ 100
METRIC RATING
6th/ 347
METRIC RANK
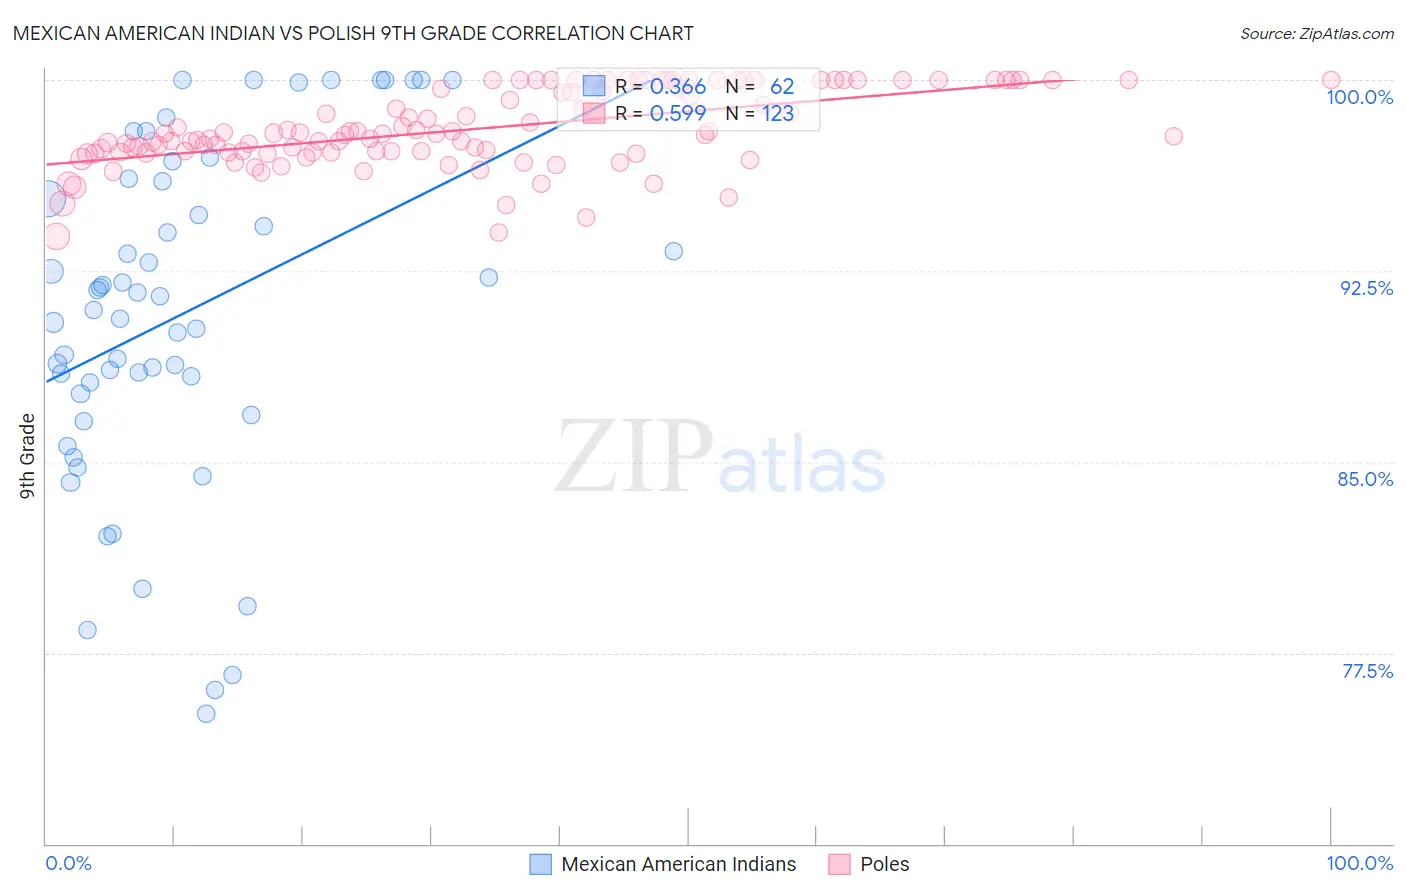
Mexican American Indian vs Polish 9th Grade Correlation Chart
The statistical analysis conducted on geographies consisting of 317,621,104 people shows a mild positive correlation between the proportion of Mexican American Indians and percentage of population with at least 9th grade education in the United States with a correlation coefficient (R) of 0.366 and weighted average of 90.9%. Similarly, the statistical analysis conducted on geographies consisting of 475,812,379 people shows a substantial positive correlation between the proportion of Poles and percentage of population with at least 9th grade education in the United States with a correlation coefficient (R) of 0.599 and weighted average of 96.7%, a difference of 6.4%.
9th Grade Correlation Summary
| Measurement | Mexican American Indian | Polish |
| Minimum | 75.1% | 93.8% |
| Maximum | 100.0% | 100.0% |
| Range | 24.9% | 6.2% |
| Mean | 90.8% | 98.1% |
| Median | 91.2% | 97.8% |
| Interquartile 25% (IQ1) | 87.7% | 97.2% |
| Interquartile 75% (IQ3) | 96.0% | 100.0% |
| Interquartile Range (IQR) | 8.3% | 2.8% |
| Standard Deviation (Sample) | 6.6% | 1.5% |
| Standard Deviation (Population) | 6.5% | 1.5% |
Similar Demographics by 9th Grade
Demographics Similar to Mexican American Indians by 9th Grade
In terms of 9th grade, the demographic groups most similar to Mexican American Indians are Hispanic or Latino (90.9%, a difference of 0.020%), Immigrants from Cabo Verde (90.9%, a difference of 0.030%), Immigrants from Yemen (90.8%, a difference of 0.11%), Honduran (91.0%, a difference of 0.15%), and Immigrants from the Azores (90.8%, a difference of 0.16%).
| Demographics | Rating | Rank | 9th Grade |
| Immigrants | Belize | 0.0 /100 | #324 | Tragic 91.8% |
| Central American Indians | 0.0 /100 | #325 | Tragic 91.5% |
| Immigrants | Armenia | 0.0 /100 | #326 | Tragic 91.4% |
| Immigrants | Nicaragua | 0.0 /100 | #327 | Tragic 91.3% |
| Dominicans | 0.0 /100 | #328 | Tragic 91.1% |
| Hondurans | 0.0 /100 | #329 | Tragic 91.0% |
| Immigrants | Cabo Verde | 0.0 /100 | #330 | Tragic 90.9% |
| Mexican American Indians | 0.0 /100 | #331 | Tragic 90.9% |
| Hispanics or Latinos | 0.0 /100 | #332 | Tragic 90.9% |
| Immigrants | Yemen | 0.0 /100 | #333 | Tragic 90.8% |
| Immigrants | Azores | 0.0 /100 | #334 | Tragic 90.8% |
| Immigrants | Honduras | 0.0 /100 | #335 | Tragic 90.6% |
| Immigrants | Dominican Republic | 0.0 /100 | #336 | Tragic 90.5% |
| Immigrants | Latin America | 0.0 /100 | #337 | Tragic 90.4% |
| Central Americans | 0.0 /100 | #338 | Tragic 90.4% |
Demographics Similar to Poles by 9th Grade
In terms of 9th grade, the demographic groups most similar to Poles are Swedish (96.7%, a difference of 0.010%), Carpatho Rusyn (96.7%, a difference of 0.010%), Slovene (96.7%, a difference of 0.020%), German (96.7%, a difference of 0.020%), and Tlingit-Haida (96.6%, a difference of 0.10%).
| Demographics | Rating | Rank | 9th Grade |
| Tsimshian | 100.0 /100 | #1 | Exceptional 97.0% |
| Norwegians | 100.0 /100 | #2 | Exceptional 96.9% |
| Slovaks | 100.0 /100 | #3 | Exceptional 96.9% |
| Slovenes | 100.0 /100 | #4 | Exceptional 96.7% |
| Swedes | 100.0 /100 | #5 | Exceptional 96.7% |
| Poles | 100.0 /100 | #6 | Exceptional 96.7% |
| Carpatho Rusyns | 100.0 /100 | #7 | Exceptional 96.7% |
| Germans | 100.0 /100 | #8 | Exceptional 96.7% |
| Tlingit-Haida | 100.0 /100 | #9 | Exceptional 96.6% |
| Lithuanians | 100.0 /100 | #10 | Exceptional 96.6% |
| Finns | 100.0 /100 | #11 | Exceptional 96.6% |
| English | 100.0 /100 | #12 | Exceptional 96.6% |
| Danes | 100.0 /100 | #13 | Exceptional 96.5% |
| Scottish | 100.0 /100 | #14 | Exceptional 96.5% |
| Irish | 100.0 /100 | #15 | Exceptional 96.5% |