Irish vs Immigrants from Vietnam Male Disability
COMPARE
Irish
Immigrants from Vietnam
Male Disability
Male Disability Comparison
Irish
Immigrants from Vietnam
12.7%
MALE DISABILITY
0.0/ 100
METRIC RATING
282nd/ 347
METRIC RANK
10.6%
MALE DISABILITY
97.9/ 100
METRIC RATING
87th/ 347
METRIC RANK
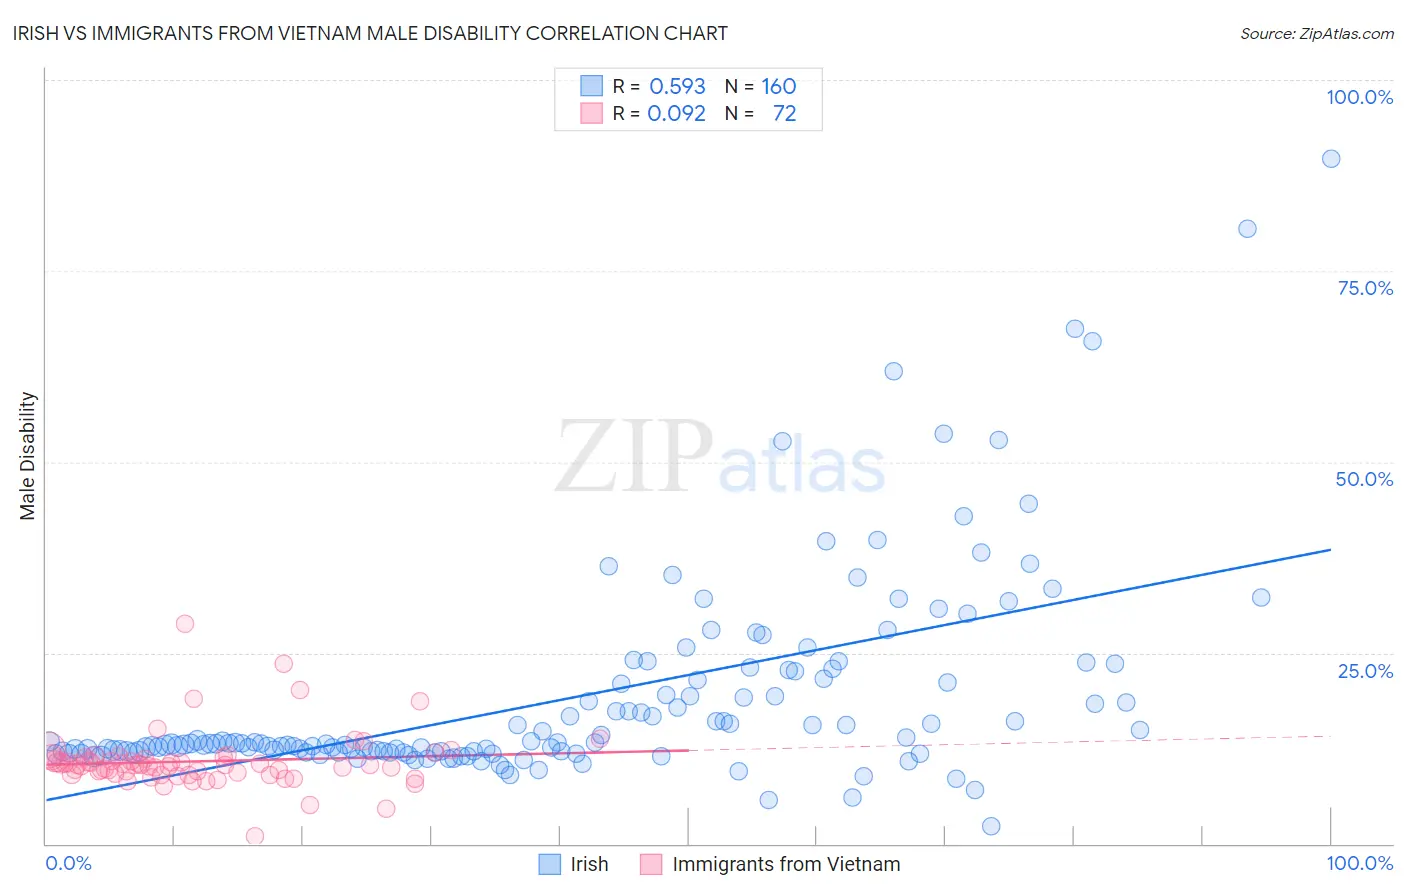
Irish vs Immigrants from Vietnam Male Disability Correlation Chart
The statistical analysis conducted on geographies consisting of 580,201,634 people shows a substantial positive correlation between the proportion of Irish and percentage of males with a disability in the United States with a correlation coefficient (R) of 0.593 and weighted average of 12.7%. Similarly, the statistical analysis conducted on geographies consisting of 404,767,194 people shows a slight positive correlation between the proportion of Immigrants from Vietnam and percentage of males with a disability in the United States with a correlation coefficient (R) of 0.092 and weighted average of 10.6%, a difference of 19.7%.
Male Disability Correlation Summary
| Measurement | Irish | Immigrants from Vietnam |
| Minimum | 2.4% | 0.96% |
| Maximum | 89.8% | 28.8% |
| Range | 87.4% | 27.9% |
| Mean | 19.1% | 10.8% |
| Median | 13.1% | 10.3% |
| Interquartile 25% (IQ1) | 12.0% | 9.1% |
| Interquartile 75% (IQ3) | 21.6% | 11.2% |
| Interquartile Range (IQR) | 9.5% | 2.1% |
| Standard Deviation (Sample) | 13.6% | 3.8% |
| Standard Deviation (Population) | 13.5% | 3.8% |
Similar Demographics by Male Disability
Demographics Similar to Irish by Male Disability
In terms of male disability, the demographic groups most similar to Irish are German (12.7%, a difference of 0.010%), Sioux (12.7%, a difference of 0.060%), Dutch (12.7%, a difference of 0.11%), Slovak (12.7%, a difference of 0.16%), and Spanish (12.7%, a difference of 0.28%).
| Demographics | Rating | Rank | Male Disability |
| Fijians | 0.0 /100 | #275 | Tragic 12.6% |
| Africans | 0.0 /100 | #276 | Tragic 12.6% |
| Finns | 0.0 /100 | #277 | Tragic 12.6% |
| Central American Indians | 0.0 /100 | #278 | Tragic 12.7% |
| Slovaks | 0.0 /100 | #279 | Tragic 12.7% |
| Dutch | 0.0 /100 | #280 | Tragic 12.7% |
| Sioux | 0.0 /100 | #281 | Tragic 12.7% |
| Irish | 0.0 /100 | #282 | Tragic 12.7% |
| Germans | 0.0 /100 | #283 | Tragic 12.7% |
| Spanish | 0.0 /100 | #284 | Tragic 12.7% |
| Welsh | 0.0 /100 | #285 | Tragic 12.7% |
| Scottish | 0.0 /100 | #286 | Tragic 12.8% |
| Cape Verdeans | 0.0 /100 | #287 | Tragic 12.8% |
| Yup'ik | 0.0 /100 | #288 | Tragic 12.8% |
| Immigrants | Cabo Verde | 0.0 /100 | #289 | Tragic 12.8% |
Demographics Similar to Immigrants from Vietnam by Male Disability
In terms of male disability, the demographic groups most similar to Immigrants from Vietnam are Immigrants from Ireland (10.6%, a difference of 0.020%), Sri Lankan (10.6%, a difference of 0.030%), Immigrants from Western Asia (10.6%, a difference of 0.070%), Immigrants from Nicaragua (10.6%, a difference of 0.070%), and Immigrants from Morocco (10.6%, a difference of 0.12%).
| Demographics | Rating | Rank | Male Disability |
| Immigrants | Jordan | 98.4 /100 | #80 | Exceptional 10.6% |
| Immigrants | Chile | 98.3 /100 | #81 | Exceptional 10.6% |
| Immigrants | Guyana | 98.2 /100 | #82 | Exceptional 10.6% |
| Immigrants | Poland | 98.1 /100 | #83 | Exceptional 10.6% |
| Bulgarians | 98.1 /100 | #84 | Exceptional 10.6% |
| Sri Lankans | 97.9 /100 | #85 | Exceptional 10.6% |
| Immigrants | Ireland | 97.9 /100 | #86 | Exceptional 10.6% |
| Immigrants | Vietnam | 97.9 /100 | #87 | Exceptional 10.6% |
| Immigrants | Western Asia | 97.8 /100 | #88 | Exceptional 10.6% |
| Immigrants | Nicaragua | 97.8 /100 | #89 | Exceptional 10.6% |
| Immigrants | Morocco | 97.7 /100 | #90 | Exceptional 10.6% |
| Immigrants | France | 97.6 /100 | #91 | Exceptional 10.6% |
| Palestinians | 97.4 /100 | #92 | Exceptional 10.7% |
| Immigrants | St. Vincent and the Grenadines | 97.1 /100 | #93 | Exceptional 10.7% |
| Immigrants | Sweden | 96.9 /100 | #94 | Exceptional 10.7% |