Irish vs Immigrants from Liberia Male Disability
COMPARE
Irish
Immigrants from Liberia
Male Disability
Male Disability Comparison
Irish
Immigrants from Liberia
12.7%
MALE DISABILITY
0.0/ 100
METRIC RATING
282nd/ 347
METRIC RANK
11.9%
MALE DISABILITY
1.0/ 100
METRIC RATING
245th/ 347
METRIC RANK
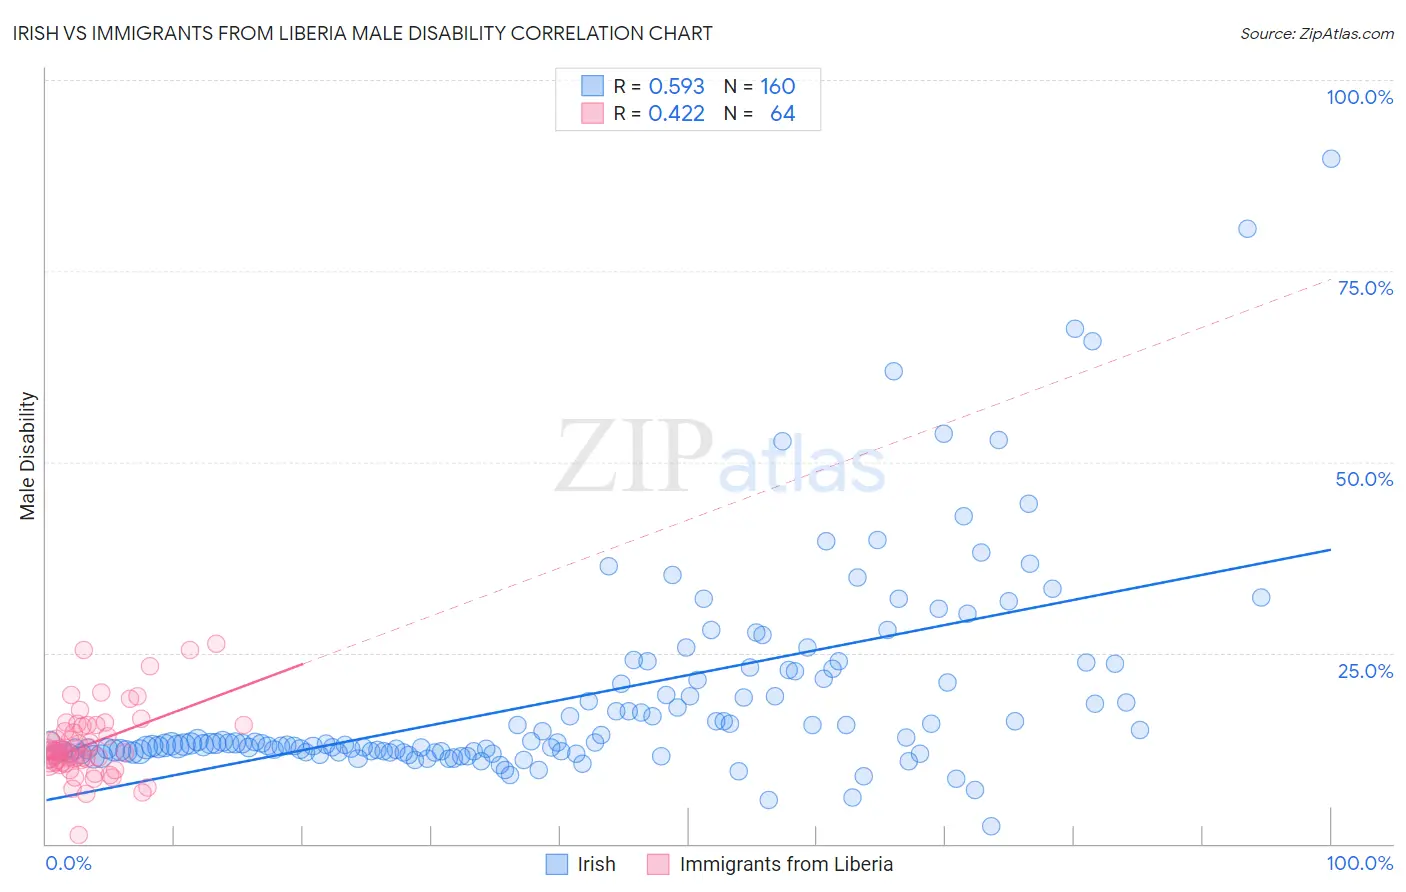
Irish vs Immigrants from Liberia Male Disability Correlation Chart
The statistical analysis conducted on geographies consisting of 580,201,634 people shows a substantial positive correlation between the proportion of Irish and percentage of males with a disability in the United States with a correlation coefficient (R) of 0.593 and weighted average of 12.7%. Similarly, the statistical analysis conducted on geographies consisting of 135,258,288 people shows a moderate positive correlation between the proportion of Immigrants from Liberia and percentage of males with a disability in the United States with a correlation coefficient (R) of 0.422 and weighted average of 11.9%, a difference of 6.5%.
Male Disability Correlation Summary
| Measurement | Irish | Immigrants from Liberia |
| Minimum | 2.4% | 1.1% |
| Maximum | 89.8% | 26.3% |
| Range | 87.4% | 25.2% |
| Mean | 19.1% | 13.0% |
| Median | 13.1% | 12.1% |
| Interquartile 25% (IQ1) | 12.0% | 10.6% |
| Interquartile 75% (IQ3) | 21.6% | 15.5% |
| Interquartile Range (IQR) | 9.5% | 4.9% |
| Standard Deviation (Sample) | 13.6% | 4.6% |
| Standard Deviation (Population) | 13.5% | 4.5% |
Similar Demographics by Male Disability
Demographics Similar to Irish by Male Disability
In terms of male disability, the demographic groups most similar to Irish are German (12.7%, a difference of 0.010%), Sioux (12.7%, a difference of 0.060%), Dutch (12.7%, a difference of 0.11%), Slovak (12.7%, a difference of 0.16%), and Spanish (12.7%, a difference of 0.28%).
| Demographics | Rating | Rank | Male Disability |
| Fijians | 0.0 /100 | #275 | Tragic 12.6% |
| Africans | 0.0 /100 | #276 | Tragic 12.6% |
| Finns | 0.0 /100 | #277 | Tragic 12.6% |
| Central American Indians | 0.0 /100 | #278 | Tragic 12.7% |
| Slovaks | 0.0 /100 | #279 | Tragic 12.7% |
| Dutch | 0.0 /100 | #280 | Tragic 12.7% |
| Sioux | 0.0 /100 | #281 | Tragic 12.7% |
| Irish | 0.0 /100 | #282 | Tragic 12.7% |
| Germans | 0.0 /100 | #283 | Tragic 12.7% |
| Spanish | 0.0 /100 | #284 | Tragic 12.7% |
| Welsh | 0.0 /100 | #285 | Tragic 12.7% |
| Scottish | 0.0 /100 | #286 | Tragic 12.8% |
| Cape Verdeans | 0.0 /100 | #287 | Tragic 12.8% |
| Yup'ik | 0.0 /100 | #288 | Tragic 12.8% |
| Immigrants | Cabo Verde | 0.0 /100 | #289 | Tragic 12.8% |
Demographics Similar to Immigrants from Liberia by Male Disability
In terms of male disability, the demographic groups most similar to Immigrants from Liberia are Immigrants from Laos (11.9%, a difference of 0.0%), Danish (11.9%, a difference of 0.030%), Samoan (11.9%, a difference of 0.12%), Northern European (11.9%, a difference of 0.15%), and Bahamian (11.9%, a difference of 0.16%).
| Demographics | Rating | Rank | Male Disability |
| Yugoslavians | 1.2 /100 | #238 | Tragic 11.9% |
| Italians | 1.2 /100 | #239 | Tragic 11.9% |
| Czechs | 1.1 /100 | #240 | Tragic 11.9% |
| Bahamians | 1.1 /100 | #241 | Tragic 11.9% |
| Northern Europeans | 1.1 /100 | #242 | Tragic 11.9% |
| Samoans | 1.1 /100 | #243 | Tragic 11.9% |
| Immigrants | Laos | 1.0 /100 | #244 | Tragic 11.9% |
| Immigrants | Liberia | 1.0 /100 | #245 | Tragic 11.9% |
| Danes | 0.9 /100 | #246 | Tragic 11.9% |
| Hungarians | 0.8 /100 | #247 | Tragic 12.0% |
| Poles | 0.7 /100 | #248 | Tragic 12.0% |
| Immigrants | Yemen | 0.5 /100 | #249 | Tragic 12.0% |
| Bangladeshis | 0.5 /100 | #250 | Tragic 12.0% |
| German Russians | 0.5 /100 | #251 | Tragic 12.0% |
| Slovenes | 0.5 /100 | #252 | Tragic 12.0% |