Immigrants from Moldova vs Delaware Disability Age 5 to 17
COMPARE
Immigrants from Moldova
Delaware
Disability Age 5 to 17
Disability Age 5 to 17 Comparison
Immigrants from Moldova
Delaware
5.2%
DISABILITY AGE 5 TO 17
99.6/ 100
METRIC RATING
75th/ 347
METRIC RANK
6.5%
DISABILITY AGE 5 TO 17
0.0/ 100
METRIC RATING
319th/ 347
METRIC RANK
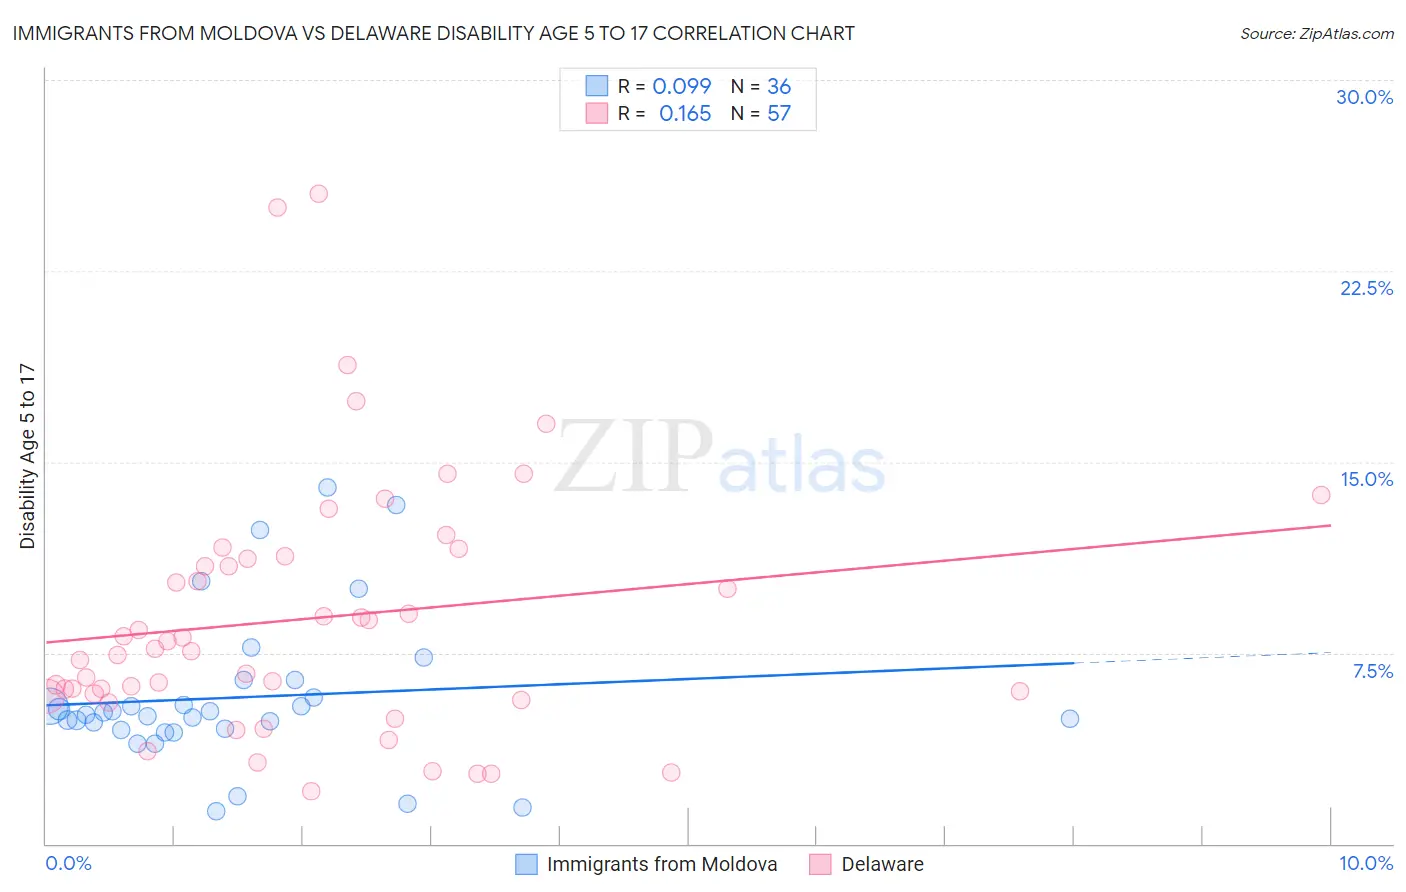
Immigrants from Moldova vs Delaware Disability Age 5 to 17 Correlation Chart
The statistical analysis conducted on geographies consisting of 123,951,863 people shows a slight positive correlation between the proportion of Immigrants from Moldova and percentage of population with a disability between the ages 5 and 17 in the United States with a correlation coefficient (R) of 0.099 and weighted average of 5.2%. Similarly, the statistical analysis conducted on geographies consisting of 95,994,789 people shows a poor positive correlation between the proportion of Delaware and percentage of population with a disability between the ages 5 and 17 in the United States with a correlation coefficient (R) of 0.165 and weighted average of 6.5%, a difference of 24.2%.
Disability Age 5 to 17 Correlation Summary
| Measurement | Immigrants from Moldova | Delaware |
| Minimum | 1.3% | 2.1% |
| Maximum | 14.0% | 25.5% |
| Range | 12.7% | 23.4% |
| Mean | 5.7% | 8.9% |
| Median | 5.1% | 7.7% |
| Interquartile 25% (IQ1) | 4.5% | 5.8% |
| Interquartile 75% (IQ3) | 6.1% | 11.3% |
| Interquartile Range (IQR) | 1.6% | 5.4% |
| Standard Deviation (Sample) | 3.0% | 5.0% |
| Standard Deviation (Population) | 2.9% | 4.9% |
Similar Demographics by Disability Age 5 to 17
Demographics Similar to Immigrants from Moldova by Disability Age 5 to 17
In terms of disability age 5 to 17, the demographic groups most similar to Immigrants from Moldova are Immigrants from Guyana (5.2%, a difference of 0.040%), Immigrants from Kazakhstan (5.2%, a difference of 0.070%), Immigrants from Cuba (5.2%, a difference of 0.070%), Afghan (5.2%, a difference of 0.11%), and Sri Lankan (5.2%, a difference of 0.14%).
| Demographics | Rating | Rank | Disability Age 5 to 17 |
| Immigrants | Syria | 99.7 /100 | #68 | Exceptional 5.2% |
| Guyanese | 99.7 /100 | #69 | Exceptional 5.2% |
| Immigrants | Belgium | 99.7 /100 | #70 | Exceptional 5.2% |
| Jordanians | 99.7 /100 | #71 | Exceptional 5.2% |
| Immigrants | Vietnam | 99.7 /100 | #72 | Exceptional 5.2% |
| Immigrants | Czechoslovakia | 99.7 /100 | #73 | Exceptional 5.2% |
| Immigrants | Romania | 99.7 /100 | #74 | Exceptional 5.2% |
| Immigrants | Moldova | 99.6 /100 | #75 | Exceptional 5.2% |
| Immigrants | Guyana | 99.6 /100 | #76 | Exceptional 5.2% |
| Immigrants | Kazakhstan | 99.6 /100 | #77 | Exceptional 5.2% |
| Immigrants | Cuba | 99.6 /100 | #78 | Exceptional 5.2% |
| Afghans | 99.6 /100 | #79 | Exceptional 5.2% |
| Sri Lankans | 99.6 /100 | #80 | Exceptional 5.2% |
| Native Hawaiians | 99.6 /100 | #81 | Exceptional 5.2% |
| Immigrants | Sweden | 99.5 /100 | #82 | Exceptional 5.2% |
Demographics Similar to Delaware by Disability Age 5 to 17
In terms of disability age 5 to 17, the demographic groups most similar to Delaware are African (6.5%, a difference of 0.19%), Tohono O'odham (6.5%, a difference of 0.54%), Comanche (6.4%, a difference of 0.55%), Slovak (6.5%, a difference of 0.56%), and Kiowa (6.4%, a difference of 0.58%).
| Demographics | Rating | Rank | Disability Age 5 to 17 |
| Bermudans | 0.0 /100 | #312 | Tragic 6.4% |
| Apache | 0.0 /100 | #313 | Tragic 6.4% |
| French | 0.0 /100 | #314 | Tragic 6.4% |
| Immigrants | Portugal | 0.0 /100 | #315 | Tragic 6.4% |
| Immigrants | Dominican Republic | 0.0 /100 | #316 | Tragic 6.4% |
| Kiowa | 0.0 /100 | #317 | Tragic 6.4% |
| Comanche | 0.0 /100 | #318 | Tragic 6.4% |
| Delaware | 0.0 /100 | #319 | Tragic 6.5% |
| Africans | 0.0 /100 | #320 | Tragic 6.5% |
| Tohono O'odham | 0.0 /100 | #321 | Tragic 6.5% |
| Slovaks | 0.0 /100 | #322 | Tragic 6.5% |
| Osage | 0.0 /100 | #323 | Tragic 6.5% |
| Dominicans | 0.0 /100 | #324 | Tragic 6.5% |
| Americans | 0.0 /100 | #325 | Tragic 6.5% |
| Potawatomi | 0.0 /100 | #326 | Tragic 6.5% |