Immigrants from Moldova vs Delaware Cognitive Disability
COMPARE
Immigrants from Moldova
Delaware
Cognitive Disability
Cognitive Disability Comparison
Immigrants from Moldova
Delaware
16.7%
COGNITIVE DISABILITY
99.1/ 100
METRIC RATING
85th/ 347
METRIC RANK
17.4%
COGNITIVE DISABILITY
25.6/ 100
METRIC RATING
193rd/ 347
METRIC RANK
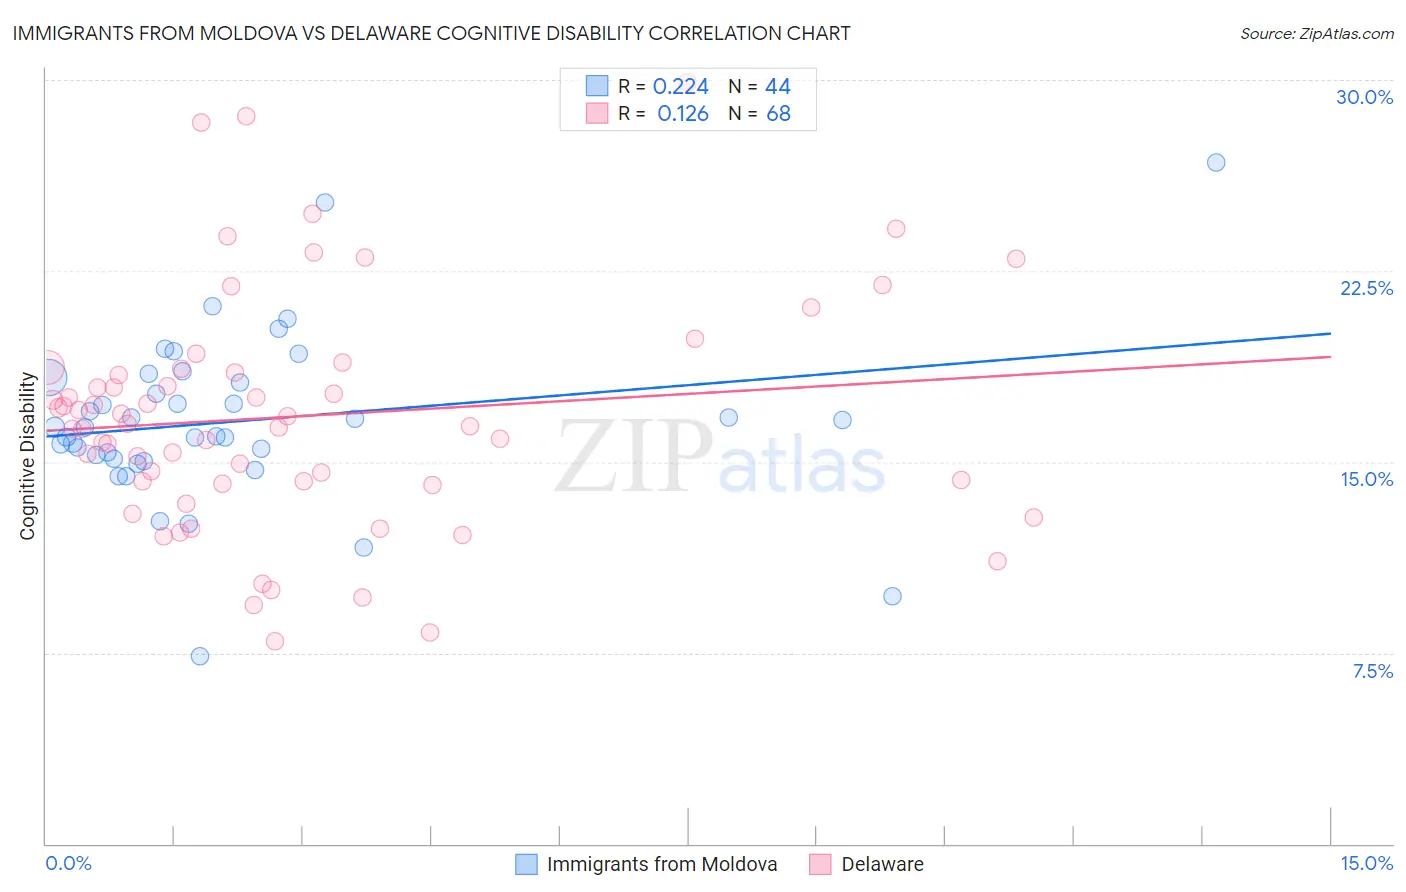
Immigrants from Moldova vs Delaware Cognitive Disability Correlation Chart
The statistical analysis conducted on geographies consisting of 124,376,689 people shows a weak positive correlation between the proportion of Immigrants from Moldova and percentage of population with cognitive disability in the United States with a correlation coefficient (R) of 0.224 and weighted average of 16.7%. Similarly, the statistical analysis conducted on geographies consisting of 96,240,838 people shows a poor positive correlation between the proportion of Delaware and percentage of population with cognitive disability in the United States with a correlation coefficient (R) of 0.126 and weighted average of 17.4%, a difference of 4.2%.
Cognitive Disability Correlation Summary
| Measurement | Immigrants from Moldova | Delaware |
| Minimum | 7.4% | 8.0% |
| Maximum | 26.8% | 29.9% |
| Range | 19.4% | 21.9% |
| Mean | 16.6% | 16.8% |
| Median | 16.4% | 16.5% |
| Interquartile 25% (IQ1) | 15.2% | 14.2% |
| Interquartile 75% (IQ3) | 18.2% | 18.6% |
| Interquartile Range (IQR) | 3.0% | 4.4% |
| Standard Deviation (Sample) | 3.4% | 4.6% |
| Standard Deviation (Population) | 3.3% | 4.6% |
Similar Demographics by Cognitive Disability
Demographics Similar to Immigrants from Moldova by Cognitive Disability
In terms of cognitive disability, the demographic groups most similar to Immigrants from Moldova are Belgian (16.7%, a difference of 0.020%), Serbian (16.7%, a difference of 0.030%), Immigrants from South Africa (16.7%, a difference of 0.030%), Native Hawaiian (16.7%, a difference of 0.050%), and Swiss (16.7%, a difference of 0.10%).
| Demographics | Rating | Rank | Cognitive Disability |
| Peruvians | 99.3 /100 | #78 | Exceptional 16.7% |
| Immigrants | Bulgaria | 99.3 /100 | #79 | Exceptional 16.7% |
| Egyptians | 99.2 /100 | #80 | Exceptional 16.7% |
| Immigrants | Netherlands | 99.2 /100 | #81 | Exceptional 16.7% |
| Swiss | 99.2 /100 | #82 | Exceptional 16.7% |
| Serbians | 99.1 /100 | #83 | Exceptional 16.7% |
| Belgians | 99.1 /100 | #84 | Exceptional 16.7% |
| Immigrants | Moldova | 99.1 /100 | #85 | Exceptional 16.7% |
| Immigrants | South Africa | 99.0 /100 | #86 | Exceptional 16.7% |
| Native Hawaiians | 99.0 /100 | #87 | Exceptional 16.7% |
| Immigrants | Philippines | 99.0 /100 | #88 | Exceptional 16.7% |
| Immigrants | Egypt | 98.8 /100 | #89 | Exceptional 16.7% |
| South Americans | 98.8 /100 | #90 | Exceptional 16.7% |
| Danes | 98.8 /100 | #91 | Exceptional 16.7% |
| Immigrants | South America | 98.8 /100 | #92 | Exceptional 16.7% |
Demographics Similar to Delaware by Cognitive Disability
In terms of cognitive disability, the demographic groups most similar to Delaware are Immigrants from Haiti (17.4%, a difference of 0.050%), Nonimmigrants (17.4%, a difference of 0.060%), Immigrants from Spain (17.4%, a difference of 0.070%), Immigrants from Western Asia (17.4%, a difference of 0.14%), and Immigrants from Bosnia and Herzegovina (17.4%, a difference of 0.14%).
| Demographics | Rating | Rank | Cognitive Disability |
| Cambodians | 35.9 /100 | #186 | Fair 17.3% |
| Immigrants | Fiji | 33.7 /100 | #187 | Fair 17.4% |
| Immigrants | France | 29.8 /100 | #188 | Fair 17.4% |
| Immigrants | Western Asia | 29.5 /100 | #189 | Fair 17.4% |
| Immigrants | Spain | 27.7 /100 | #190 | Fair 17.4% |
| Immigrants | Nonimmigrants | 27.4 /100 | #191 | Fair 17.4% |
| Immigrants | Haiti | 27.1 /100 | #192 | Fair 17.4% |
| Delaware | 25.6 /100 | #193 | Fair 17.4% |
| Immigrants | Bosnia and Herzegovina | 22.0 /100 | #194 | Fair 17.4% |
| New Zealanders | 21.1 /100 | #195 | Fair 17.4% |
| Guyanese | 17.5 /100 | #196 | Poor 17.5% |
| Immigrants | Afghanistan | 16.7 /100 | #197 | Poor 17.5% |
| Immigrants | Panama | 14.8 /100 | #198 | Poor 17.5% |
| Immigrants | Singapore | 14.3 /100 | #199 | Poor 17.5% |
| Haitians | 14.1 /100 | #200 | Poor 17.5% |