Immigrants from Moldova vs Immigrants from Senegal Disability Age 5 to 17
COMPARE
Immigrants from Moldova
Immigrants from Senegal
Disability Age 5 to 17
Disability Age 5 to 17 Comparison
Immigrants from Moldova
Immigrants from Senegal
5.2%
DISABILITY AGE 5 TO 17
99.6/ 100
METRIC RATING
75th/ 347
METRIC RANK
6.2%
DISABILITY AGE 5 TO 17
0.0/ 100
METRIC RATING
292nd/ 347
METRIC RANK
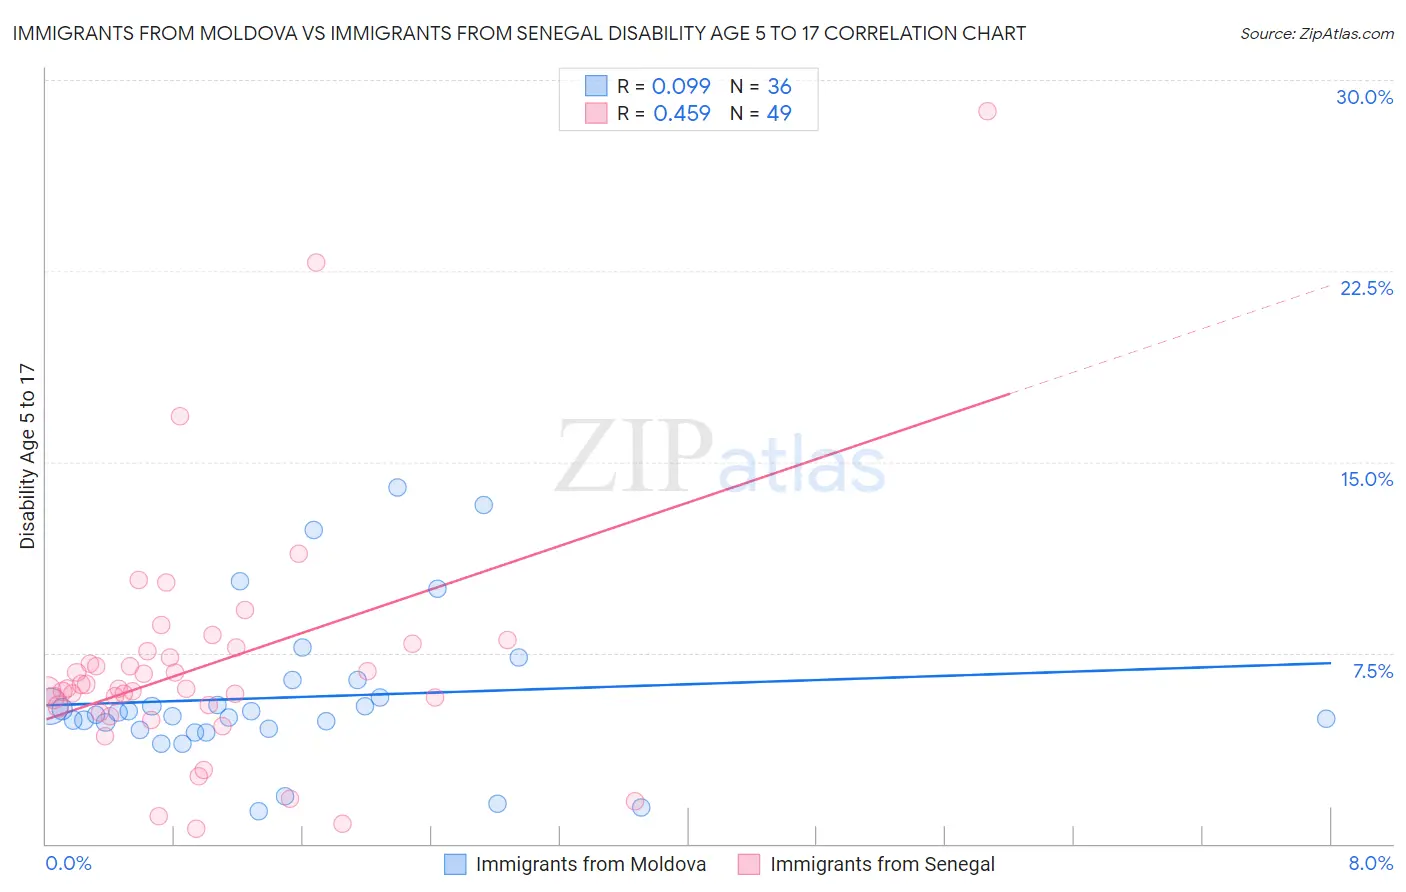
Immigrants from Moldova vs Immigrants from Senegal Disability Age 5 to 17 Correlation Chart
The statistical analysis conducted on geographies consisting of 123,951,863 people shows a slight positive correlation between the proportion of Immigrants from Moldova and percentage of population with a disability between the ages 5 and 17 in the United States with a correlation coefficient (R) of 0.099 and weighted average of 5.2%. Similarly, the statistical analysis conducted on geographies consisting of 90,044,083 people shows a moderate positive correlation between the proportion of Immigrants from Senegal and percentage of population with a disability between the ages 5 and 17 in the United States with a correlation coefficient (R) of 0.459 and weighted average of 6.2%, a difference of 19.2%.
Disability Age 5 to 17 Correlation Summary
| Measurement | Immigrants from Moldova | Immigrants from Senegal |
| Minimum | 1.3% | 0.58% |
| Maximum | 14.0% | 28.8% |
| Range | 12.7% | 28.2% |
| Mean | 5.7% | 7.0% |
| Median | 5.1% | 6.1% |
| Interquartile 25% (IQ1) | 4.5% | 5.3% |
| Interquartile 75% (IQ3) | 6.1% | 7.6% |
| Interquartile Range (IQR) | 1.6% | 2.3% |
| Standard Deviation (Sample) | 3.0% | 4.8% |
| Standard Deviation (Population) | 2.9% | 4.8% |
Similar Demographics by Disability Age 5 to 17
Demographics Similar to Immigrants from Moldova by Disability Age 5 to 17
In terms of disability age 5 to 17, the demographic groups most similar to Immigrants from Moldova are Immigrants from Guyana (5.2%, a difference of 0.040%), Immigrants from Kazakhstan (5.2%, a difference of 0.070%), Immigrants from Cuba (5.2%, a difference of 0.070%), Afghan (5.2%, a difference of 0.11%), and Sri Lankan (5.2%, a difference of 0.14%).
| Demographics | Rating | Rank | Disability Age 5 to 17 |
| Immigrants | Syria | 99.7 /100 | #68 | Exceptional 5.2% |
| Guyanese | 99.7 /100 | #69 | Exceptional 5.2% |
| Immigrants | Belgium | 99.7 /100 | #70 | Exceptional 5.2% |
| Jordanians | 99.7 /100 | #71 | Exceptional 5.2% |
| Immigrants | Vietnam | 99.7 /100 | #72 | Exceptional 5.2% |
| Immigrants | Czechoslovakia | 99.7 /100 | #73 | Exceptional 5.2% |
| Immigrants | Romania | 99.7 /100 | #74 | Exceptional 5.2% |
| Immigrants | Moldova | 99.6 /100 | #75 | Exceptional 5.2% |
| Immigrants | Guyana | 99.6 /100 | #76 | Exceptional 5.2% |
| Immigrants | Kazakhstan | 99.6 /100 | #77 | Exceptional 5.2% |
| Immigrants | Cuba | 99.6 /100 | #78 | Exceptional 5.2% |
| Afghans | 99.6 /100 | #79 | Exceptional 5.2% |
| Sri Lankans | 99.6 /100 | #80 | Exceptional 5.2% |
| Native Hawaiians | 99.6 /100 | #81 | Exceptional 5.2% |
| Immigrants | Sweden | 99.5 /100 | #82 | Exceptional 5.2% |
Demographics Similar to Immigrants from Senegal by Disability Age 5 to 17
In terms of disability age 5 to 17, the demographic groups most similar to Immigrants from Senegal are Central American Indian (6.2%, a difference of 0.020%), Irish (6.2%, a difference of 0.020%), White/Caucasian (6.2%, a difference of 0.24%), Cree (6.2%, a difference of 0.29%), and Spanish American (6.2%, a difference of 0.32%).
| Demographics | Rating | Rank | Disability Age 5 to 17 |
| English | 0.0 /100 | #285 | Tragic 6.2% |
| Colville | 0.0 /100 | #286 | Tragic 6.2% |
| Pima | 0.0 /100 | #287 | Tragic 6.2% |
| Jamaicans | 0.0 /100 | #288 | Tragic 6.2% |
| Yaqui | 0.0 /100 | #289 | Tragic 6.2% |
| Immigrants | Congo | 0.0 /100 | #290 | Tragic 6.2% |
| Whites/Caucasians | 0.0 /100 | #291 | Tragic 6.2% |
| Immigrants | Senegal | 0.0 /100 | #292 | Tragic 6.2% |
| Central American Indians | 0.0 /100 | #293 | Tragic 6.2% |
| Irish | 0.0 /100 | #294 | Tragic 6.2% |
| Cree | 0.0 /100 | #295 | Tragic 6.2% |
| Spanish Americans | 0.0 /100 | #296 | Tragic 6.2% |
| Immigrants | Bahamas | 0.0 /100 | #297 | Tragic 6.2% |
| Lumbee | 0.0 /100 | #298 | Tragic 6.2% |
| Welsh | 0.0 /100 | #299 | Tragic 6.3% |