Korean vs Delaware Disability Age 5 to 17
COMPARE
Korean
Delaware
Disability Age 5 to 17
Disability Age 5 to 17 Comparison
Koreans
Delaware
5.1%
DISABILITY AGE 5 TO 17
100.0/ 100
METRIC RATING
48th/ 347
METRIC RANK
6.5%
DISABILITY AGE 5 TO 17
0.0/ 100
METRIC RATING
319th/ 347
METRIC RANK
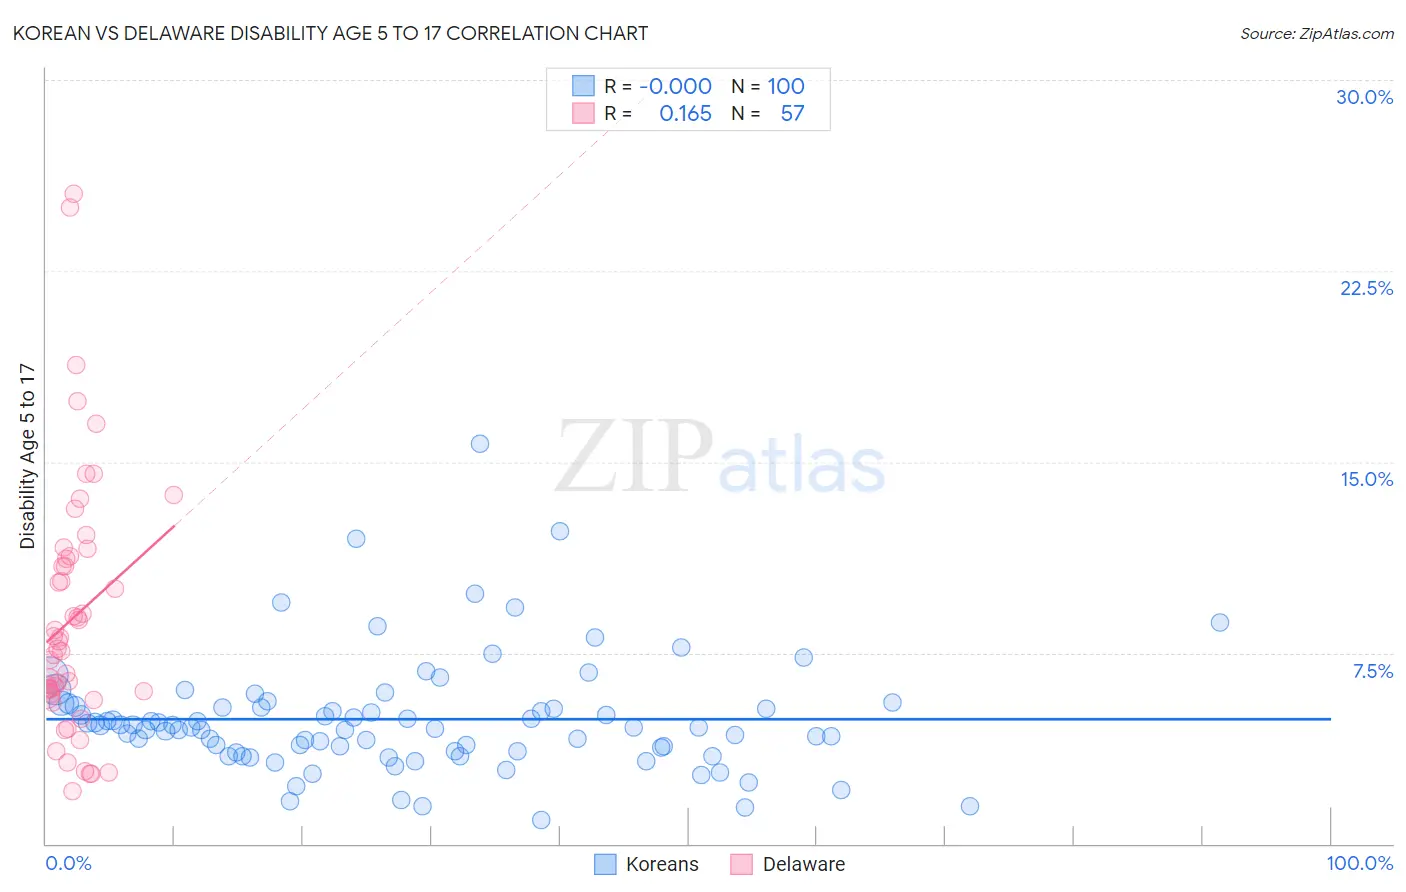
Korean vs Delaware Disability Age 5 to 17 Correlation Chart
The statistical analysis conducted on geographies consisting of 504,185,597 people shows no correlation between the proportion of Koreans and percentage of population with a disability between the ages 5 and 17 in the United States with a correlation coefficient (R) of -0.000 and weighted average of 5.1%. Similarly, the statistical analysis conducted on geographies consisting of 95,994,789 people shows a poor positive correlation between the proportion of Delaware and percentage of population with a disability between the ages 5 and 17 in the United States with a correlation coefficient (R) of 0.165 and weighted average of 6.5%, a difference of 28.0%.
Disability Age 5 to 17 Correlation Summary
| Measurement | Korean | Delaware |
| Minimum | 0.91% | 2.1% |
| Maximum | 15.7% | 25.5% |
| Range | 14.8% | 23.4% |
| Mean | 4.9% | 8.9% |
| Median | 4.6% | 7.7% |
| Interquartile 25% (IQ1) | 3.6% | 5.8% |
| Interquartile 75% (IQ3) | 5.4% | 11.3% |
| Interquartile Range (IQR) | 1.8% | 5.4% |
| Standard Deviation (Sample) | 2.3% | 5.0% |
| Standard Deviation (Population) | 2.3% | 4.9% |
Similar Demographics by Disability Age 5 to 17
Demographics Similar to Koreans by Disability Age 5 to 17
In terms of disability age 5 to 17, the demographic groups most similar to Koreans are Immigrants from Western Asia (5.1%, a difference of 0.080%), Vietnamese (5.1%, a difference of 0.18%), Assyrian/Chaldean/Syriac (5.0%, a difference of 0.31%), Tongan (5.0%, a difference of 0.38%), and Egyptian (5.0%, a difference of 0.45%).
| Demographics | Rating | Rank | Disability Age 5 to 17 |
| Immigrants | Australia | 100.0 /100 | #41 | Exceptional 5.0% |
| Immigrants | Sri Lanka | 100.0 /100 | #42 | Exceptional 5.0% |
| Immigrants | Russia | 100.0 /100 | #43 | Exceptional 5.0% |
| Egyptians | 100.0 /100 | #44 | Exceptional 5.0% |
| Tongans | 100.0 /100 | #45 | Exceptional 5.0% |
| Assyrians/Chaldeans/Syriacs | 100.0 /100 | #46 | Exceptional 5.0% |
| Vietnamese | 100.0 /100 | #47 | Exceptional 5.1% |
| Koreans | 100.0 /100 | #48 | Exceptional 5.1% |
| Immigrants | Western Asia | 100.0 /100 | #49 | Exceptional 5.1% |
| Argentineans | 99.9 /100 | #50 | Exceptional 5.1% |
| Turks | 99.9 /100 | #51 | Exceptional 5.1% |
| Immigrants | Fiji | 99.9 /100 | #52 | Exceptional 5.1% |
| Immigrants | Lithuania | 99.9 /100 | #53 | Exceptional 5.1% |
| Paraguayans | 99.9 /100 | #54 | Exceptional 5.1% |
| Laotians | 99.9 /100 | #55 | Exceptional 5.1% |
Demographics Similar to Delaware by Disability Age 5 to 17
In terms of disability age 5 to 17, the demographic groups most similar to Delaware are African (6.5%, a difference of 0.19%), Tohono O'odham (6.5%, a difference of 0.54%), Comanche (6.4%, a difference of 0.55%), Slovak (6.5%, a difference of 0.56%), and Kiowa (6.4%, a difference of 0.58%).
| Demographics | Rating | Rank | Disability Age 5 to 17 |
| Bermudans | 0.0 /100 | #312 | Tragic 6.4% |
| Apache | 0.0 /100 | #313 | Tragic 6.4% |
| French | 0.0 /100 | #314 | Tragic 6.4% |
| Immigrants | Portugal | 0.0 /100 | #315 | Tragic 6.4% |
| Immigrants | Dominican Republic | 0.0 /100 | #316 | Tragic 6.4% |
| Kiowa | 0.0 /100 | #317 | Tragic 6.4% |
| Comanche | 0.0 /100 | #318 | Tragic 6.4% |
| Delaware | 0.0 /100 | #319 | Tragic 6.5% |
| Africans | 0.0 /100 | #320 | Tragic 6.5% |
| Tohono O'odham | 0.0 /100 | #321 | Tragic 6.5% |
| Slovaks | 0.0 /100 | #322 | Tragic 6.5% |
| Osage | 0.0 /100 | #323 | Tragic 6.5% |
| Dominicans | 0.0 /100 | #324 | Tragic 6.5% |
| Americans | 0.0 /100 | #325 | Tragic 6.5% |
| Potawatomi | 0.0 /100 | #326 | Tragic 6.5% |