Immigrants from Zaire vs Delaware Disability Age 5 to 17
COMPARE
Immigrants from Zaire
Delaware
Disability Age 5 to 17
Disability Age 5 to 17 Comparison
Immigrants from Zaire
Delaware
6.0%
DISABILITY AGE 5 TO 17
0.2/ 100
METRIC RATING
271st/ 347
METRIC RANK
6.5%
DISABILITY AGE 5 TO 17
0.0/ 100
METRIC RATING
319th/ 347
METRIC RANK
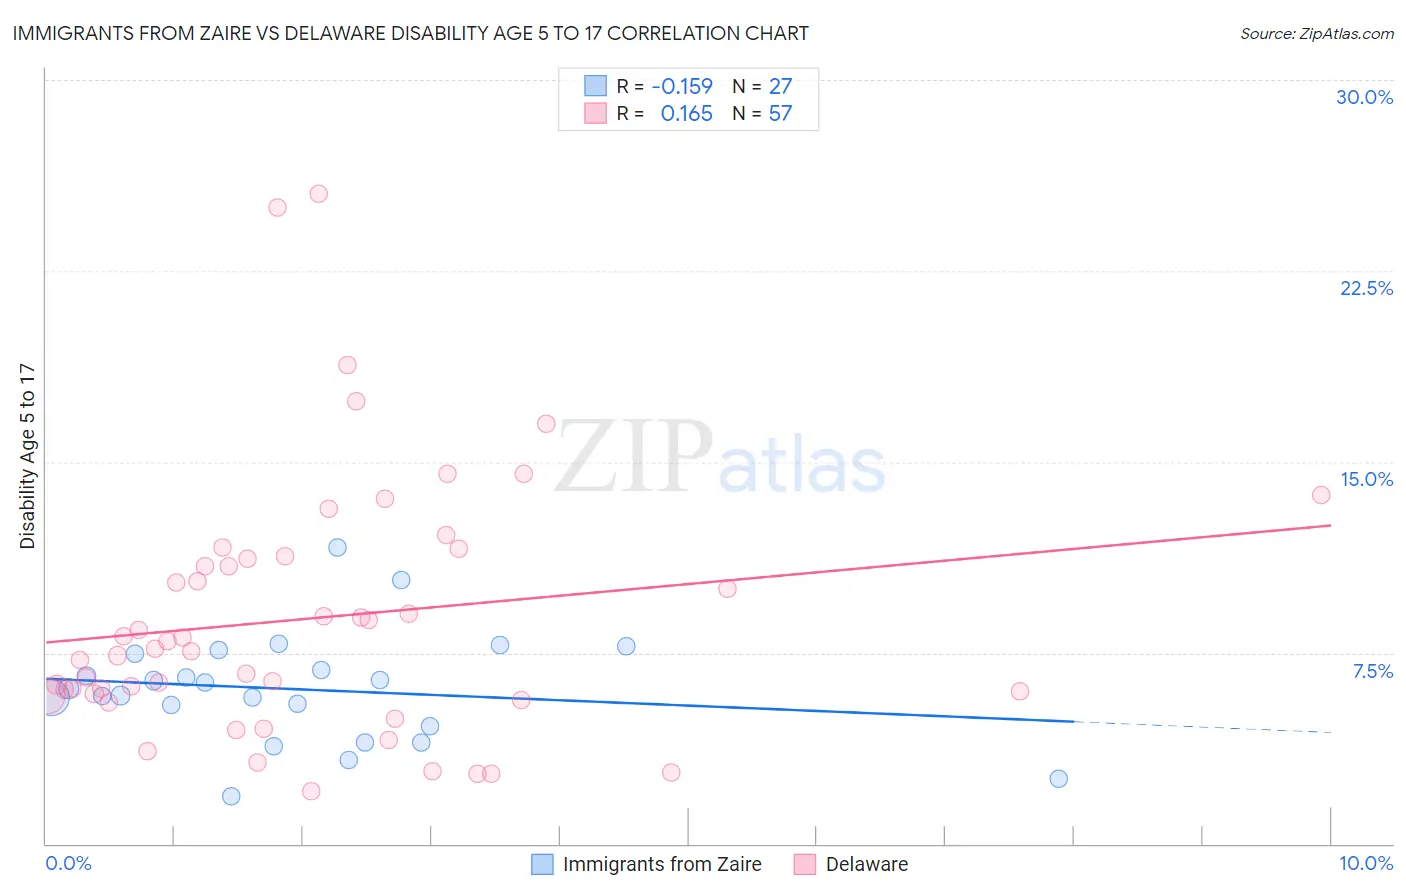
Immigrants from Zaire vs Delaware Disability Age 5 to 17 Correlation Chart
The statistical analysis conducted on geographies consisting of 107,054,393 people shows a poor negative correlation between the proportion of Immigrants from Zaire and percentage of population with a disability between the ages 5 and 17 in the United States with a correlation coefficient (R) of -0.159 and weighted average of 6.0%. Similarly, the statistical analysis conducted on geographies consisting of 95,994,789 people shows a poor positive correlation between the proportion of Delaware and percentage of population with a disability between the ages 5 and 17 in the United States with a correlation coefficient (R) of 0.165 and weighted average of 6.5%, a difference of 7.5%.
Disability Age 5 to 17 Correlation Summary
| Measurement | Immigrants from Zaire | Delaware |
| Minimum | 1.9% | 2.1% |
| Maximum | 11.6% | 25.5% |
| Range | 9.7% | 23.4% |
| Mean | 6.1% | 8.9% |
| Median | 6.1% | 7.7% |
| Interquartile 25% (IQ1) | 4.6% | 5.8% |
| Interquartile 75% (IQ3) | 7.4% | 11.3% |
| Interquartile Range (IQR) | 2.8% | 5.4% |
| Standard Deviation (Sample) | 2.1% | 5.0% |
| Standard Deviation (Population) | 2.1% | 4.9% |
Similar Demographics by Disability Age 5 to 17
Demographics Similar to Immigrants from Zaire by Disability Age 5 to 17
In terms of disability age 5 to 17, the demographic groups most similar to Immigrants from Zaire are Finnish (6.0%, a difference of 0.030%), Alaska Native (6.0%, a difference of 0.080%), Cheyenne (6.0%, a difference of 0.19%), Dutch (6.0%, a difference of 0.30%), and Japanese (6.1%, a difference of 0.40%).
| Demographics | Rating | Rank | Disability Age 5 to 17 |
| Canadians | 0.6 /100 | #264 | Tragic 6.0% |
| Panamanians | 0.6 /100 | #265 | Tragic 6.0% |
| Slovenes | 0.6 /100 | #266 | Tragic 6.0% |
| Spanish | 0.5 /100 | #267 | Tragic 6.0% |
| Sioux | 0.4 /100 | #268 | Tragic 6.0% |
| Liberians | 0.4 /100 | #269 | Tragic 6.0% |
| Immigrants | Somalia | 0.4 /100 | #270 | Tragic 6.0% |
| Immigrants | Zaire | 0.2 /100 | #271 | Tragic 6.0% |
| Finns | 0.2 /100 | #272 | Tragic 6.0% |
| Alaska Natives | 0.2 /100 | #273 | Tragic 6.0% |
| Cheyenne | 0.2 /100 | #274 | Tragic 6.0% |
| Dutch | 0.2 /100 | #275 | Tragic 6.0% |
| Japanese | 0.1 /100 | #276 | Tragic 6.1% |
| Puget Sound Salish | 0.1 /100 | #277 | Tragic 6.1% |
| Immigrants | Liberia | 0.1 /100 | #278 | Tragic 6.1% |
Demographics Similar to Delaware by Disability Age 5 to 17
In terms of disability age 5 to 17, the demographic groups most similar to Delaware are African (6.5%, a difference of 0.19%), Tohono O'odham (6.5%, a difference of 0.54%), Comanche (6.4%, a difference of 0.55%), Slovak (6.5%, a difference of 0.56%), and Kiowa (6.4%, a difference of 0.58%).
| Demographics | Rating | Rank | Disability Age 5 to 17 |
| Bermudans | 0.0 /100 | #312 | Tragic 6.4% |
| Apache | 0.0 /100 | #313 | Tragic 6.4% |
| French | 0.0 /100 | #314 | Tragic 6.4% |
| Immigrants | Portugal | 0.0 /100 | #315 | Tragic 6.4% |
| Immigrants | Dominican Republic | 0.0 /100 | #316 | Tragic 6.4% |
| Kiowa | 0.0 /100 | #317 | Tragic 6.4% |
| Comanche | 0.0 /100 | #318 | Tragic 6.4% |
| Delaware | 0.0 /100 | #319 | Tragic 6.5% |
| Africans | 0.0 /100 | #320 | Tragic 6.5% |
| Tohono O'odham | 0.0 /100 | #321 | Tragic 6.5% |
| Slovaks | 0.0 /100 | #322 | Tragic 6.5% |
| Osage | 0.0 /100 | #323 | Tragic 6.5% |
| Dominicans | 0.0 /100 | #324 | Tragic 6.5% |
| Americans | 0.0 /100 | #325 | Tragic 6.5% |
| Potawatomi | 0.0 /100 | #326 | Tragic 6.5% |