Immigrants from Moldova vs Immigrants from Hungary Disability Age 5 to 17
COMPARE
Immigrants from Moldova
Immigrants from Hungary
Disability Age 5 to 17
Disability Age 5 to 17 Comparison
Immigrants from Moldova
Immigrants from Hungary
5.2%
DISABILITY AGE 5 TO 17
99.6/ 100
METRIC RATING
75th/ 347
METRIC RANK
5.5%
DISABILITY AGE 5 TO 17
87.9/ 100
METRIC RATING
143rd/ 347
METRIC RANK
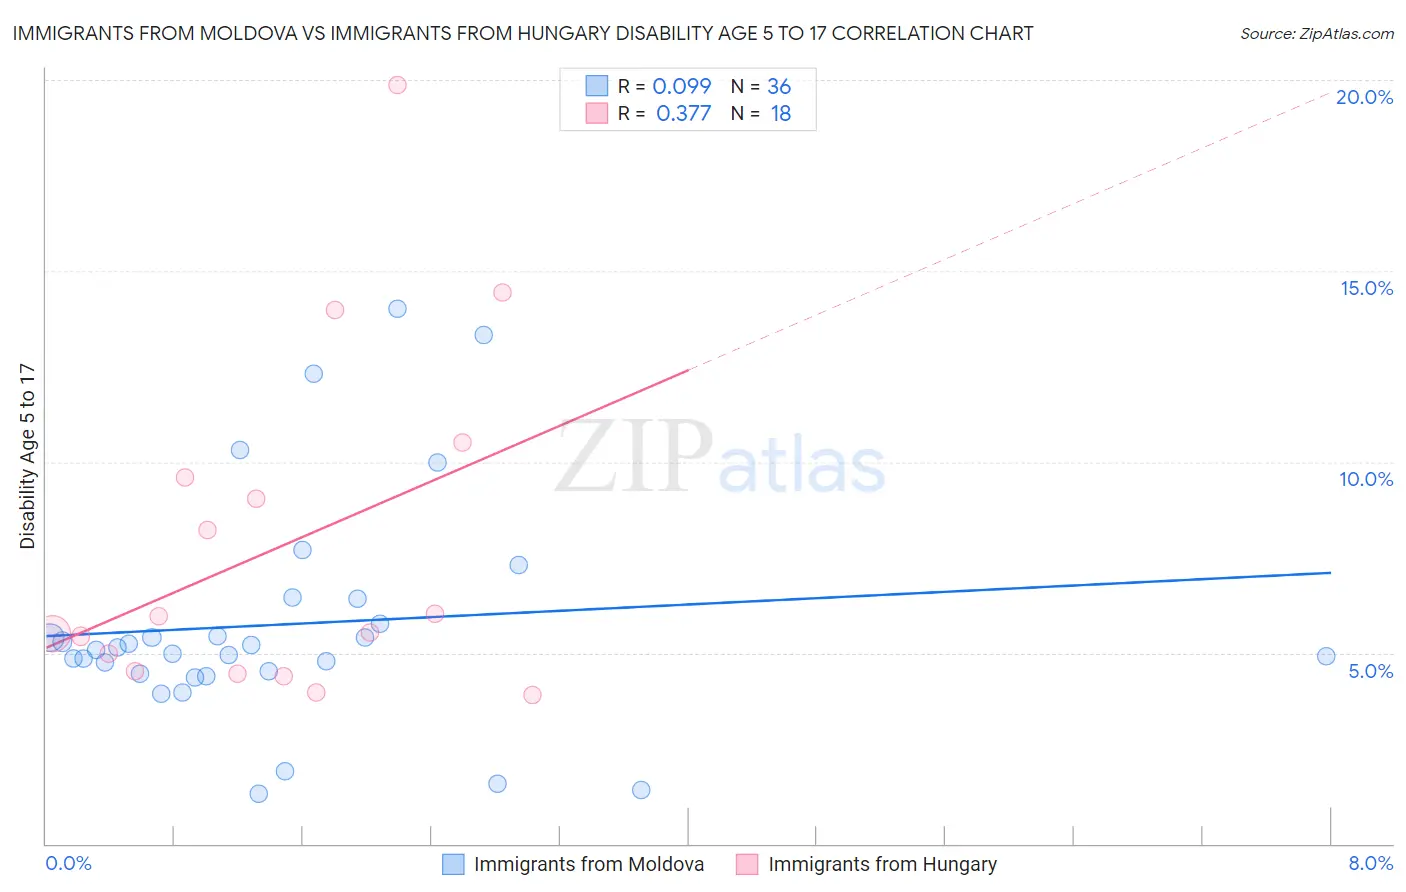
Immigrants from Moldova vs Immigrants from Hungary Disability Age 5 to 17 Correlation Chart
The statistical analysis conducted on geographies consisting of 123,951,863 people shows a slight positive correlation between the proportion of Immigrants from Moldova and percentage of population with a disability between the ages 5 and 17 in the United States with a correlation coefficient (R) of 0.099 and weighted average of 5.2%. Similarly, the statistical analysis conducted on geographies consisting of 194,505,610 people shows a mild positive correlation between the proportion of Immigrants from Hungary and percentage of population with a disability between the ages 5 and 17 in the United States with a correlation coefficient (R) of 0.377 and weighted average of 5.5%, a difference of 4.7%.
Disability Age 5 to 17 Correlation Summary
| Measurement | Immigrants from Moldova | Immigrants from Hungary |
| Minimum | 1.3% | 3.9% |
| Maximum | 14.0% | 19.9% |
| Range | 12.7% | 16.0% |
| Mean | 5.7% | 7.8% |
| Median | 5.1% | 5.7% |
| Interquartile 25% (IQ1) | 4.5% | 4.5% |
| Interquartile 75% (IQ3) | 6.1% | 9.6% |
| Interquartile Range (IQR) | 1.6% | 5.1% |
| Standard Deviation (Sample) | 3.0% | 4.4% |
| Standard Deviation (Population) | 2.9% | 4.3% |
Similar Demographics by Disability Age 5 to 17
Demographics Similar to Immigrants from Moldova by Disability Age 5 to 17
In terms of disability age 5 to 17, the demographic groups most similar to Immigrants from Moldova are Immigrants from Guyana (5.2%, a difference of 0.040%), Immigrants from Kazakhstan (5.2%, a difference of 0.070%), Immigrants from Cuba (5.2%, a difference of 0.070%), Afghan (5.2%, a difference of 0.11%), and Sri Lankan (5.2%, a difference of 0.14%).
| Demographics | Rating | Rank | Disability Age 5 to 17 |
| Immigrants | Syria | 99.7 /100 | #68 | Exceptional 5.2% |
| Guyanese | 99.7 /100 | #69 | Exceptional 5.2% |
| Immigrants | Belgium | 99.7 /100 | #70 | Exceptional 5.2% |
| Jordanians | 99.7 /100 | #71 | Exceptional 5.2% |
| Immigrants | Vietnam | 99.7 /100 | #72 | Exceptional 5.2% |
| Immigrants | Czechoslovakia | 99.7 /100 | #73 | Exceptional 5.2% |
| Immigrants | Romania | 99.7 /100 | #74 | Exceptional 5.2% |
| Immigrants | Moldova | 99.6 /100 | #75 | Exceptional 5.2% |
| Immigrants | Guyana | 99.6 /100 | #76 | Exceptional 5.2% |
| Immigrants | Kazakhstan | 99.6 /100 | #77 | Exceptional 5.2% |
| Immigrants | Cuba | 99.6 /100 | #78 | Exceptional 5.2% |
| Afghans | 99.6 /100 | #79 | Exceptional 5.2% |
| Sri Lankans | 99.6 /100 | #80 | Exceptional 5.2% |
| Native Hawaiians | 99.6 /100 | #81 | Exceptional 5.2% |
| Immigrants | Sweden | 99.5 /100 | #82 | Exceptional 5.2% |
Demographics Similar to Immigrants from Hungary by Disability Age 5 to 17
In terms of disability age 5 to 17, the demographic groups most similar to Immigrants from Hungary are Colombian (5.5%, a difference of 0.020%), Pakistani (5.5%, a difference of 0.070%), Immigrants from Guatemala (5.5%, a difference of 0.14%), South American Indian (5.5%, a difference of 0.17%), and Immigrants from Netherlands (5.4%, a difference of 0.34%).
| Demographics | Rating | Rank | Disability Age 5 to 17 |
| Immigrants | Denmark | 91.4 /100 | #136 | Exceptional 5.4% |
| Navajo | 90.9 /100 | #137 | Exceptional 5.4% |
| Immigrants | Oceania | 90.8 /100 | #138 | Exceptional 5.4% |
| Belizeans | 90.8 /100 | #139 | Exceptional 5.4% |
| Immigrants | Netherlands | 90.5 /100 | #140 | Exceptional 5.4% |
| South American Indians | 89.3 /100 | #141 | Excellent 5.5% |
| Colombians | 88.0 /100 | #142 | Excellent 5.5% |
| Immigrants | Hungary | 87.9 /100 | #143 | Excellent 5.5% |
| Pakistanis | 87.3 /100 | #144 | Excellent 5.5% |
| Immigrants | Guatemala | 86.6 /100 | #145 | Excellent 5.5% |
| Albanians | 83.7 /100 | #146 | Excellent 5.5% |
| Immigrants | Albania | 83.1 /100 | #147 | Excellent 5.5% |
| Samoans | 81.9 /100 | #148 | Excellent 5.5% |
| Central Americans | 81.6 /100 | #149 | Excellent 5.5% |
| Guatemalans | 81.5 /100 | #150 | Excellent 5.5% |