Czechoslovakian vs Delaware Disability Age 5 to 17
COMPARE
Czechoslovakian
Delaware
Disability Age 5 to 17
Disability Age 5 to 17 Comparison
Czechoslovakians
Delaware
5.9%
DISABILITY AGE 5 TO 17
0.7/ 100
METRIC RATING
263rd/ 347
METRIC RANK
6.5%
DISABILITY AGE 5 TO 17
0.0/ 100
METRIC RATING
319th/ 347
METRIC RANK
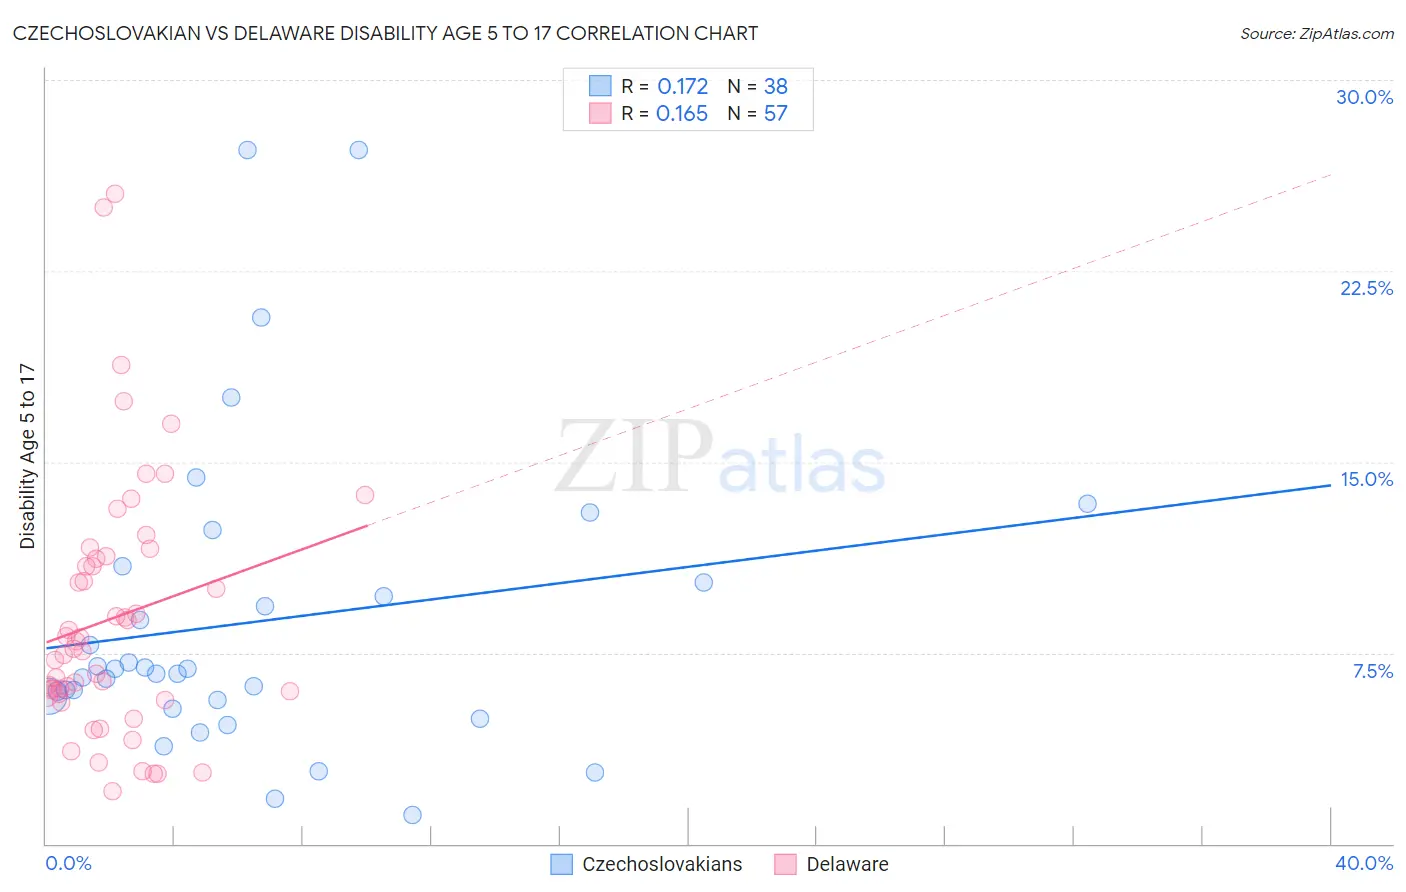
Czechoslovakian vs Delaware Disability Age 5 to 17 Correlation Chart
The statistical analysis conducted on geographies consisting of 365,368,249 people shows a poor positive correlation between the proportion of Czechoslovakians and percentage of population with a disability between the ages 5 and 17 in the United States with a correlation coefficient (R) of 0.172 and weighted average of 5.9%. Similarly, the statistical analysis conducted on geographies consisting of 95,994,789 people shows a poor positive correlation between the proportion of Delaware and percentage of population with a disability between the ages 5 and 17 in the United States with a correlation coefficient (R) of 0.165 and weighted average of 6.5%, a difference of 9.0%.
Disability Age 5 to 17 Correlation Summary
| Measurement | Czechoslovakian | Delaware |
| Minimum | 1.1% | 2.1% |
| Maximum | 27.3% | 25.5% |
| Range | 26.2% | 23.4% |
| Mean | 8.7% | 8.9% |
| Median | 6.8% | 7.7% |
| Interquartile 25% (IQ1) | 5.6% | 5.8% |
| Interquartile 75% (IQ3) | 10.3% | 11.3% |
| Interquartile Range (IQR) | 4.7% | 5.4% |
| Standard Deviation (Sample) | 6.0% | 5.0% |
| Standard Deviation (Population) | 5.9% | 4.9% |
Similar Demographics by Disability Age 5 to 17
Demographics Similar to Czechoslovakians by Disability Age 5 to 17
In terms of disability age 5 to 17, the demographic groups most similar to Czechoslovakians are Immigrants from Western Africa (5.9%, a difference of 0.080%), Immigrants from Middle Africa (5.9%, a difference of 0.11%), Canadian (6.0%, a difference of 0.12%), Somali (5.9%, a difference of 0.18%), and Panamanian (6.0%, a difference of 0.19%).
| Demographics | Rating | Rank | Disability Age 5 to 17 |
| Hopi | 1.0 /100 | #256 | Tragic 5.9% |
| Hispanics or Latinos | 1.0 /100 | #257 | Tragic 5.9% |
| Brazilians | 0.9 /100 | #258 | Tragic 5.9% |
| Slavs | 0.9 /100 | #259 | Tragic 5.9% |
| Somalis | 0.8 /100 | #260 | Tragic 5.9% |
| Immigrants | Middle Africa | 0.7 /100 | #261 | Tragic 5.9% |
| Immigrants | Western Africa | 0.7 /100 | #262 | Tragic 5.9% |
| Czechoslovakians | 0.7 /100 | #263 | Tragic 5.9% |
| Canadians | 0.6 /100 | #264 | Tragic 6.0% |
| Panamanians | 0.6 /100 | #265 | Tragic 6.0% |
| Slovenes | 0.6 /100 | #266 | Tragic 6.0% |
| Spanish | 0.5 /100 | #267 | Tragic 6.0% |
| Sioux | 0.4 /100 | #268 | Tragic 6.0% |
| Liberians | 0.4 /100 | #269 | Tragic 6.0% |
| Immigrants | Somalia | 0.4 /100 | #270 | Tragic 6.0% |
Demographics Similar to Delaware by Disability Age 5 to 17
In terms of disability age 5 to 17, the demographic groups most similar to Delaware are African (6.5%, a difference of 0.19%), Tohono O'odham (6.5%, a difference of 0.54%), Comanche (6.4%, a difference of 0.55%), Slovak (6.5%, a difference of 0.56%), and Kiowa (6.4%, a difference of 0.58%).
| Demographics | Rating | Rank | Disability Age 5 to 17 |
| Bermudans | 0.0 /100 | #312 | Tragic 6.4% |
| Apache | 0.0 /100 | #313 | Tragic 6.4% |
| French | 0.0 /100 | #314 | Tragic 6.4% |
| Immigrants | Portugal | 0.0 /100 | #315 | Tragic 6.4% |
| Immigrants | Dominican Republic | 0.0 /100 | #316 | Tragic 6.4% |
| Kiowa | 0.0 /100 | #317 | Tragic 6.4% |
| Comanche | 0.0 /100 | #318 | Tragic 6.4% |
| Delaware | 0.0 /100 | #319 | Tragic 6.5% |
| Africans | 0.0 /100 | #320 | Tragic 6.5% |
| Tohono O'odham | 0.0 /100 | #321 | Tragic 6.5% |
| Slovaks | 0.0 /100 | #322 | Tragic 6.5% |
| Osage | 0.0 /100 | #323 | Tragic 6.5% |
| Dominicans | 0.0 /100 | #324 | Tragic 6.5% |
| Americans | 0.0 /100 | #325 | Tragic 6.5% |
| Potawatomi | 0.0 /100 | #326 | Tragic 6.5% |