Immigrants from Europe vs Creek Self-Care Disability
COMPARE
Immigrants from Europe
Creek
Self-Care Disability
Self-Care Disability Comparison
Immigrants from Europe
Creek
2.4%
SELF-CARE DISABILITY
69.6/ 100
METRIC RATING
157th/ 347
METRIC RANK
2.8%
SELF-CARE DISABILITY
0.0/ 100
METRIC RATING
314th/ 347
METRIC RANK
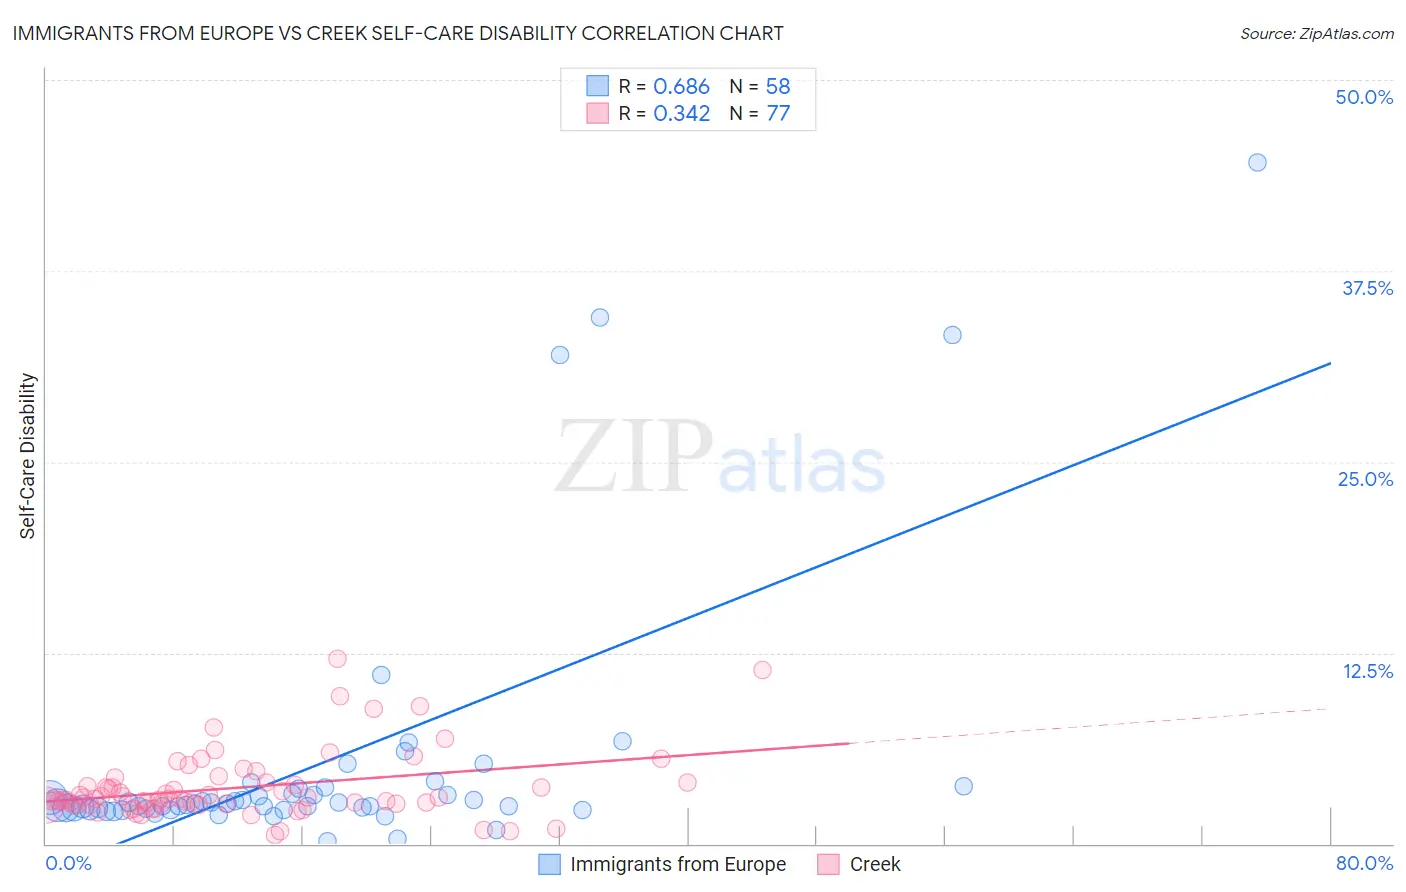
Immigrants from Europe vs Creek Self-Care Disability Correlation Chart
The statistical analysis conducted on geographies consisting of 545,734,078 people shows a significant positive correlation between the proportion of Immigrants from Europe and percentage of population with self-care disability in the United States with a correlation coefficient (R) of 0.686 and weighted average of 2.4%. Similarly, the statistical analysis conducted on geographies consisting of 178,379,870 people shows a mild positive correlation between the proportion of Creek and percentage of population with self-care disability in the United States with a correlation coefficient (R) of 0.342 and weighted average of 2.8%, a difference of 16.1%.
Self-Care Disability Correlation Summary
| Measurement | Immigrants from Europe | Creek |
| Minimum | 0.20% | 0.58% |
| Maximum | 44.6% | 12.1% |
| Range | 44.4% | 11.5% |
| Mean | 5.3% | 3.7% |
| Median | 2.6% | 2.9% |
| Interquartile 25% (IQ1) | 2.3% | 2.6% |
| Interquartile 75% (IQ3) | 3.6% | 4.0% |
| Interquartile Range (IQR) | 1.3% | 1.4% |
| Standard Deviation (Sample) | 8.7% | 2.2% |
| Standard Deviation (Population) | 8.6% | 2.2% |
Similar Demographics by Self-Care Disability
Demographics Similar to Immigrants from Europe by Self-Care Disability
In terms of self-care disability, the demographic groups most similar to Immigrants from Europe are Nigerian (2.4%, a difference of 0.060%), Immigrants from Western Europe (2.4%, a difference of 0.060%), Immigrants from Italy (2.4%, a difference of 0.060%), Pakistani (2.4%, a difference of 0.11%), and Finnish (2.4%, a difference of 0.14%).
| Demographics | Rating | Rank | Self-Care Disability |
| Immigrants | Costa Rica | 75.1 /100 | #150 | Good 2.4% |
| Basques | 74.0 /100 | #151 | Good 2.4% |
| Tlingit-Haida | 73.5 /100 | #152 | Good 2.4% |
| Immigrants | England | 73.5 /100 | #153 | Good 2.4% |
| Italians | 72.2 /100 | #154 | Good 2.4% |
| Pakistanis | 71.4 /100 | #155 | Good 2.4% |
| Nigerians | 70.6 /100 | #156 | Good 2.4% |
| Immigrants | Europe | 69.6 /100 | #157 | Good 2.4% |
| Immigrants | Western Europe | 68.6 /100 | #158 | Good 2.4% |
| Immigrants | Italy | 68.5 /100 | #159 | Good 2.4% |
| Finns | 67.0 /100 | #160 | Good 2.4% |
| Lebanese | 66.5 /100 | #161 | Good 2.4% |
| Somalis | 63.7 /100 | #162 | Good 2.5% |
| German Russians | 62.7 /100 | #163 | Good 2.5% |
| Immigrants | Vietnam | 59.3 /100 | #164 | Average 2.5% |
Demographics Similar to Creek by Self-Care Disability
In terms of self-care disability, the demographic groups most similar to Creek are Immigrants from Cuba (2.8%, a difference of 0.21%), Spanish American (2.8%, a difference of 0.22%), Immigrants from Caribbean (2.8%, a difference of 0.25%), Menominee (2.8%, a difference of 0.32%), and Immigrants from Dominica (2.8%, a difference of 0.44%).
| Demographics | Rating | Rank | Self-Care Disability |
| Natives/Alaskans | 0.0 /100 | #307 | Tragic 2.8% |
| Immigrants | Grenada | 0.0 /100 | #308 | Tragic 2.8% |
| Bangladeshis | 0.0 /100 | #309 | Tragic 2.8% |
| British West Indians | 0.0 /100 | #310 | Tragic 2.8% |
| Puget Sound Salish | 0.0 /100 | #311 | Tragic 2.8% |
| Immigrants | Caribbean | 0.0 /100 | #312 | Tragic 2.8% |
| Spanish Americans | 0.0 /100 | #313 | Tragic 2.8% |
| Creek | 0.0 /100 | #314 | Tragic 2.8% |
| Immigrants | Cuba | 0.0 /100 | #315 | Tragic 2.8% |
| Menominee | 0.0 /100 | #316 | Tragic 2.8% |
| Immigrants | Dominica | 0.0 /100 | #317 | Tragic 2.8% |
| Assyrians/Chaldeans/Syriacs | 0.0 /100 | #318 | Tragic 2.8% |
| Spanish American Indians | 0.0 /100 | #319 | Tragic 2.9% |
| Chickasaw | 0.0 /100 | #320 | Tragic 2.9% |
| Navajo | 0.0 /100 | #321 | Tragic 2.9% |