Immigrants from Europe vs South African Ambulatory Disability
COMPARE
Immigrants from Europe
South African
Ambulatory Disability
Ambulatory Disability Comparison
Immigrants from Europe
South Africans
6.0%
AMBULATORY DISABILITY
87.8/ 100
METRIC RATING
132nd/ 347
METRIC RANK
5.9%
AMBULATORY DISABILITY
96.3/ 100
METRIC RATING
112th/ 347
METRIC RANK
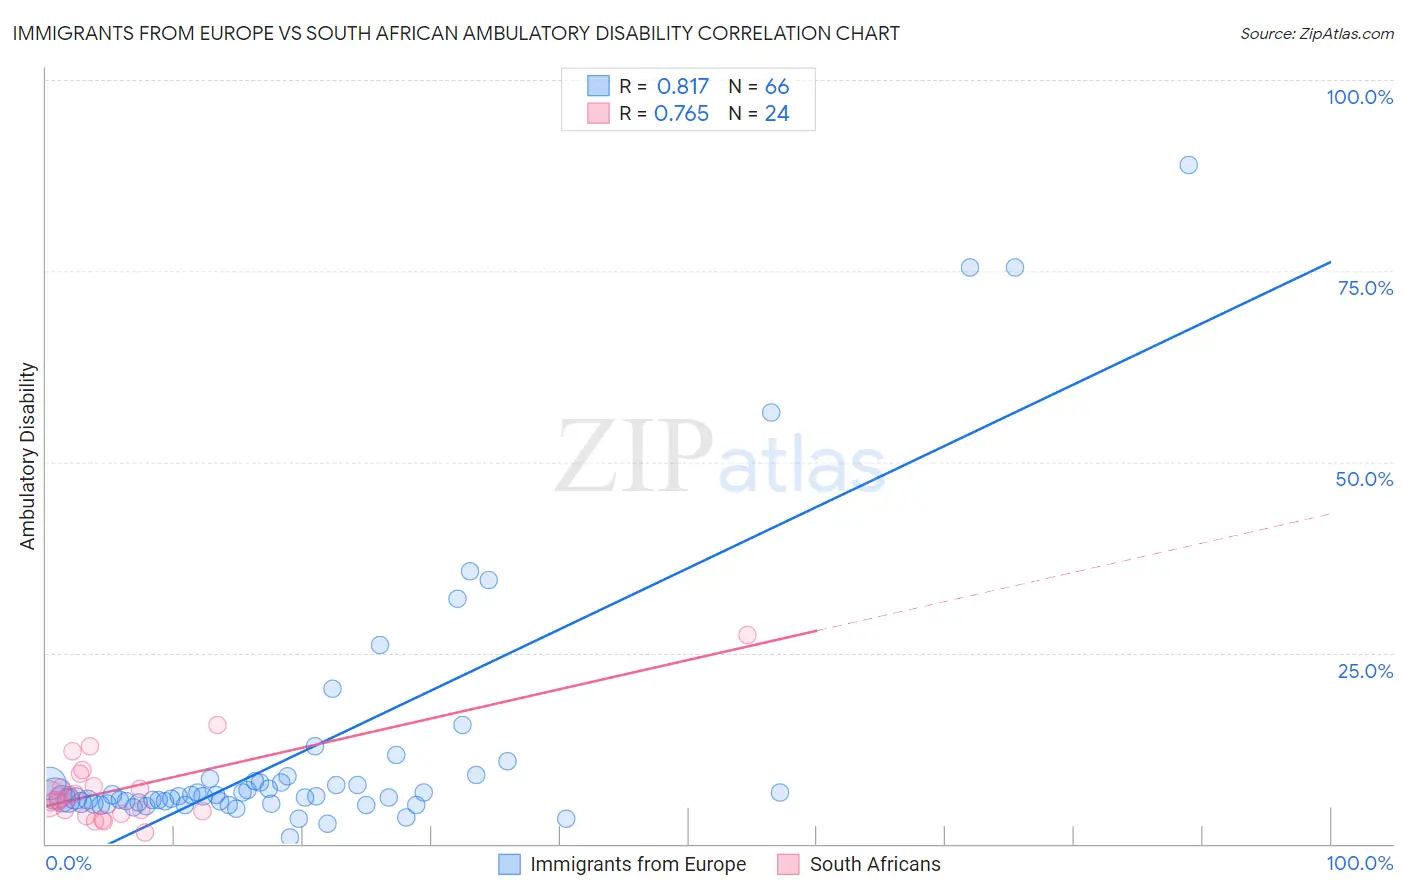
Immigrants from Europe vs South African Ambulatory Disability Correlation Chart
The statistical analysis conducted on geographies consisting of 547,017,856 people shows a very strong positive correlation between the proportion of Immigrants from Europe and percentage of population with ambulatory disability in the United States with a correlation coefficient (R) of 0.817 and weighted average of 6.0%. Similarly, the statistical analysis conducted on geographies consisting of 182,561,768 people shows a strong positive correlation between the proportion of South Africans and percentage of population with ambulatory disability in the United States with a correlation coefficient (R) of 0.765 and weighted average of 5.9%, a difference of 1.8%.
Ambulatory Disability Correlation Summary
| Measurement | Immigrants from Europe | South African |
| Minimum | 0.74% | 1.5% |
| Maximum | 88.9% | 27.3% |
| Range | 88.1% | 25.7% |
| Mean | 12.3% | 7.3% |
| Median | 6.2% | 5.8% |
| Interquartile 25% (IQ1) | 5.4% | 4.1% |
| Interquartile 75% (IQ3) | 8.2% | 8.3% |
| Interquartile Range (IQR) | 2.8% | 4.2% |
| Standard Deviation (Sample) | 17.4% | 5.4% |
| Standard Deviation (Population) | 17.3% | 5.3% |
Demographics Similar to Immigrants from Europe and South Africans by Ambulatory Disability
In terms of ambulatory disability, the demographic groups most similar to Immigrants from Europe are Immigrants from Costa Rica (5.9%, a difference of 0.24%), Immigrants from Kazakhstan (5.9%, a difference of 0.27%), Immigrants from Norway (5.9%, a difference of 0.38%), Immigrants from Western Asia (5.9%, a difference of 0.41%), and Immigrants from Nigeria (5.9%, a difference of 0.45%). Similarly, the demographic groups most similar to South Africans are Immigrants from Uruguay (5.9%, a difference of 0.22%), Immigrants from Poland (5.9%, a difference of 0.28%), South American Indian (5.9%, a difference of 0.49%), Immigrants from Africa (5.9%, a difference of 0.50%), and Immigrants from South Eastern Asia (5.9%, a difference of 0.78%).
| Demographics | Rating | Rank | Ambulatory Disability |
| South Africans | 96.3 /100 | #112 | Exceptional 5.9% |
| Immigrants | Uruguay | 95.6 /100 | #113 | Exceptional 5.9% |
| Immigrants | Poland | 95.4 /100 | #114 | Exceptional 5.9% |
| South American Indians | 94.8 /100 | #115 | Exceptional 5.9% |
| Immigrants | Africa | 94.7 /100 | #116 | Exceptional 5.9% |
| Immigrants | South Eastern Asia | 93.6 /100 | #117 | Exceptional 5.9% |
| Russians | 93.4 /100 | #118 | Exceptional 5.9% |
| Norwegians | 93.1 /100 | #119 | Exceptional 5.9% |
| Estonians | 92.9 /100 | #120 | Exceptional 5.9% |
| Costa Ricans | 92.6 /100 | #121 | Exceptional 5.9% |
| Icelanders | 92.6 /100 | #122 | Exceptional 5.9% |
| Immigrants | Russia | 92.4 /100 | #123 | Exceptional 5.9% |
| Immigrants | Middle Africa | 92.2 /100 | #124 | Exceptional 5.9% |
| Koreans | 91.6 /100 | #125 | Exceptional 5.9% |
| Arabs | 91.5 /100 | #126 | Exceptional 5.9% |
| Immigrants | Nigeria | 90.9 /100 | #127 | Exceptional 5.9% |
| Immigrants | Western Asia | 90.7 /100 | #128 | Exceptional 5.9% |
| Immigrants | Norway | 90.5 /100 | #129 | Exceptional 5.9% |
| Immigrants | Kazakhstan | 89.7 /100 | #130 | Excellent 5.9% |
| Immigrants | Costa Rica | 89.5 /100 | #131 | Excellent 5.9% |
| Immigrants | Europe | 87.8 /100 | #132 | Excellent 6.0% |