Immigrants from Congo vs Subsaharan African Disability
COMPARE
Immigrants from Congo
Subsaharan African
Disability
Disability Comparison
Immigrants from Congo
Sub-Saharan Africans
12.2%
DISABILITY
1.9/ 100
METRIC RATING
237th/ 347
METRIC RANK
12.3%
DISABILITY
1.4/ 100
METRIC RATING
250th/ 347
METRIC RANK
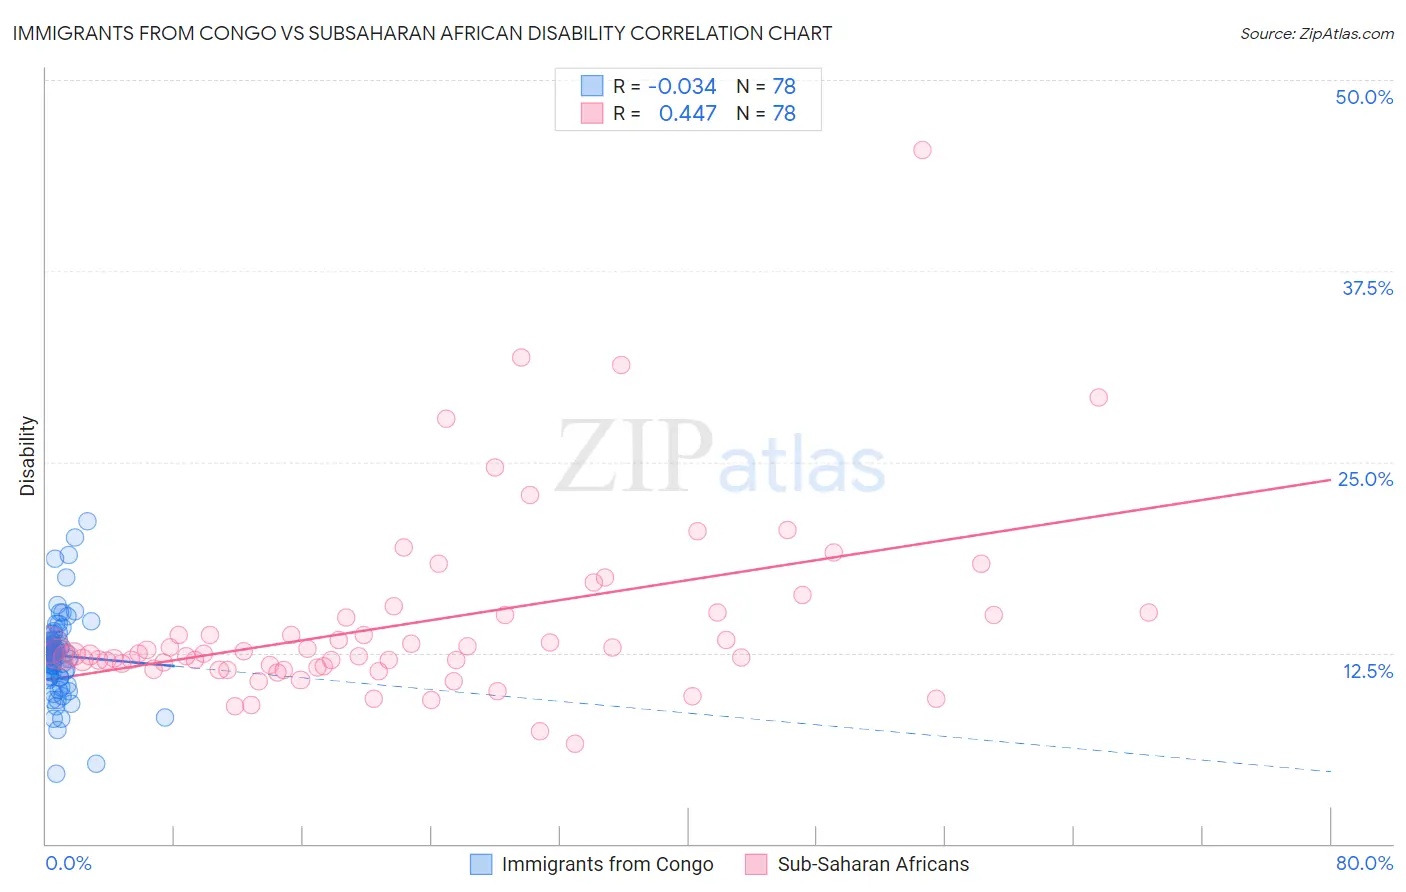
Immigrants from Congo vs Subsaharan African Disability Correlation Chart
The statistical analysis conducted on geographies consisting of 92,123,108 people shows no correlation between the proportion of Immigrants from Congo and percentage of population with a disability in the United States with a correlation coefficient (R) of -0.034 and weighted average of 12.2%. Similarly, the statistical analysis conducted on geographies consisting of 508,103,774 people shows a moderate positive correlation between the proportion of Sub-Saharan Africans and percentage of population with a disability in the United States with a correlation coefficient (R) of 0.447 and weighted average of 12.3%, a difference of 0.37%.
Disability Correlation Summary
| Measurement | Immigrants from Congo | Subsaharan African |
| Minimum | 4.6% | 6.6% |
| Maximum | 21.1% | 45.5% |
| Range | 16.5% | 38.9% |
| Mean | 12.3% | 14.4% |
| Median | 12.4% | 12.4% |
| Interquartile 25% (IQ1) | 10.9% | 11.6% |
| Interquartile 75% (IQ3) | 13.3% | 14.9% |
| Interquartile Range (IQR) | 2.4% | 3.3% |
| Standard Deviation (Sample) | 2.8% | 6.1% |
| Standard Deviation (Population) | 2.8% | 6.0% |
Demographics Similar to Immigrants from Congo and Sub-Saharan Africans by Disability
In terms of disability, the demographic groups most similar to Immigrants from Congo are Norwegian (12.2%, a difference of 0.040%), Chinese (12.2%, a difference of 0.050%), Swedish (12.2%, a difference of 0.080%), Hungarian (12.2%, a difference of 0.13%), and Yugoslavian (12.2%, a difference of 0.13%). Similarly, the demographic groups most similar to Sub-Saharan Africans are European (12.3%, a difference of 0.0%), Carpatho Rusyn (12.3%, a difference of 0.010%), Guamanian/Chamorro (12.3%, a difference of 0.020%), Indonesian (12.2%, a difference of 0.060%), and Swiss (12.2%, a difference of 0.090%).
| Demographics | Rating | Rank | Disability |
| Bahamians | 2.3 /100 | #233 | Tragic 12.2% |
| Japanese | 2.3 /100 | #234 | Tragic 12.2% |
| Yup'ik | 2.2 /100 | #235 | Tragic 12.2% |
| Chinese | 2.0 /100 | #236 | Tragic 12.2% |
| Immigrants | Congo | 1.9 /100 | #237 | Tragic 12.2% |
| Norwegians | 1.9 /100 | #238 | Tragic 12.2% |
| Swedes | 1.8 /100 | #239 | Tragic 12.2% |
| Hungarians | 1.7 /100 | #240 | Tragic 12.2% |
| Yugoslavians | 1.7 /100 | #241 | Tragic 12.2% |
| Poles | 1.7 /100 | #242 | Tragic 12.2% |
| British | 1.5 /100 | #243 | Tragic 12.2% |
| Basques | 1.5 /100 | #244 | Tragic 12.2% |
| Liberians | 1.5 /100 | #245 | Tragic 12.2% |
| Swiss | 1.5 /100 | #246 | Tragic 12.2% |
| Indonesians | 1.4 /100 | #247 | Tragic 12.2% |
| Guamanians/Chamorros | 1.4 /100 | #248 | Tragic 12.3% |
| Carpatho Rusyns | 1.4 /100 | #249 | Tragic 12.3% |
| Sub-Saharan Africans | 1.4 /100 | #250 | Tragic 12.3% |
| Europeans | 1.4 /100 | #251 | Tragic 12.3% |
| Bermudans | 1.1 /100 | #252 | Tragic 12.3% |
| Belgians | 0.8 /100 | #253 | Tragic 12.3% |