Immigrants from Congo vs Yugoslavian Disability
COMPARE
Immigrants from Congo
Yugoslavian
Disability
Disability Comparison
Immigrants from Congo
Yugoslavians
12.2%
DISABILITY
1.9/ 100
METRIC RATING
237th/ 347
METRIC RANK
12.2%
DISABILITY
1.7/ 100
METRIC RATING
241st/ 347
METRIC RANK
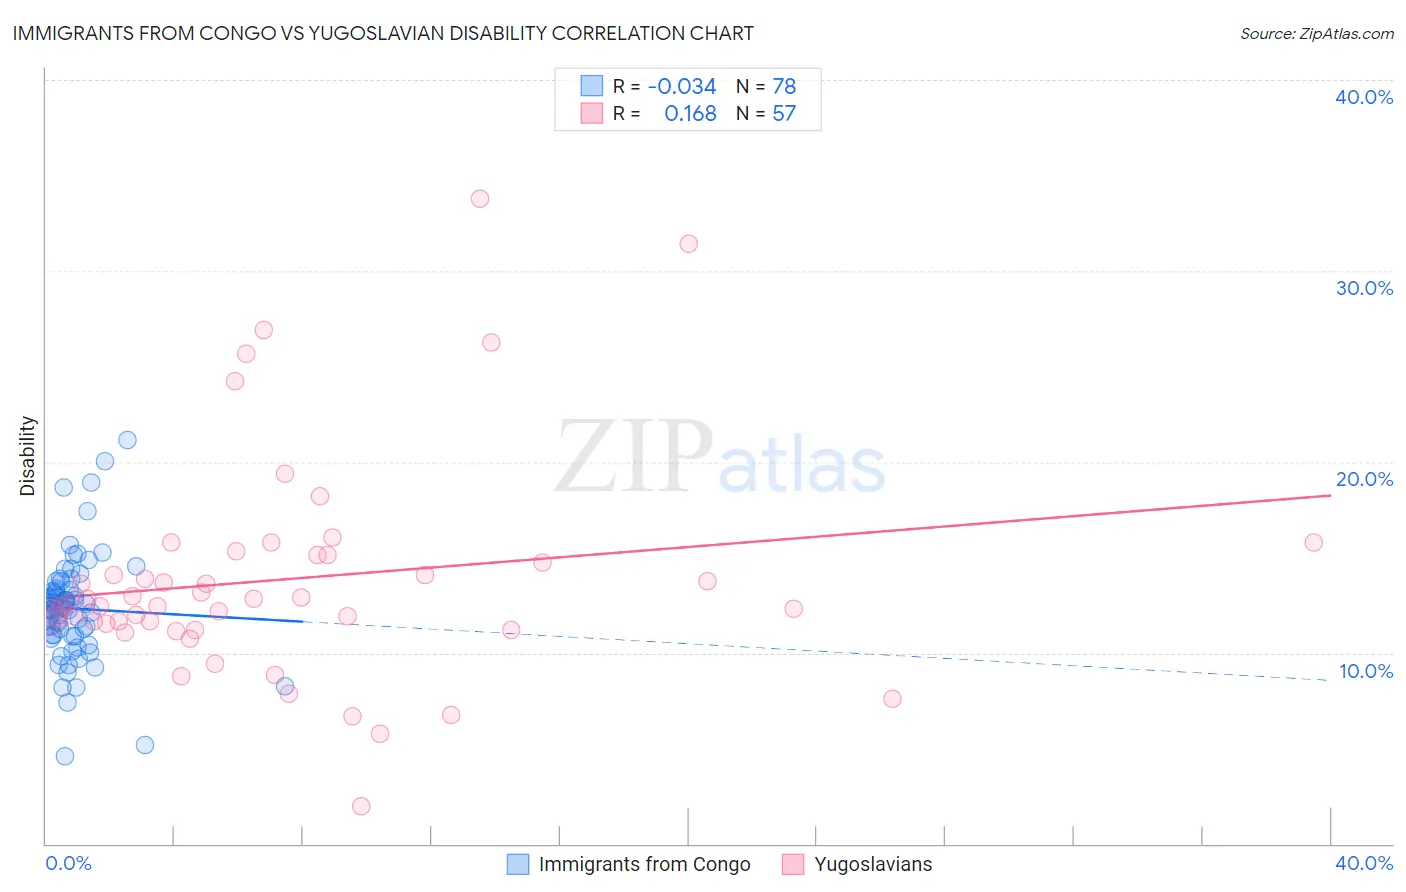
Immigrants from Congo vs Yugoslavian Disability Correlation Chart
The statistical analysis conducted on geographies consisting of 92,123,108 people shows no correlation between the proportion of Immigrants from Congo and percentage of population with a disability in the United States with a correlation coefficient (R) of -0.034 and weighted average of 12.2%. Similarly, the statistical analysis conducted on geographies consisting of 285,695,841 people shows a poor positive correlation between the proportion of Yugoslavians and percentage of population with a disability in the United States with a correlation coefficient (R) of 0.168 and weighted average of 12.2%, a difference of 0.13%.
Disability Correlation Summary
| Measurement | Immigrants from Congo | Yugoslavian |
| Minimum | 4.6% | 2.0% |
| Maximum | 21.1% | 33.8% |
| Range | 16.5% | 31.8% |
| Mean | 12.3% | 13.9% |
| Median | 12.4% | 12.6% |
| Interquartile 25% (IQ1) | 10.9% | 11.4% |
| Interquartile 75% (IQ3) | 13.3% | 15.1% |
| Interquartile Range (IQR) | 2.4% | 3.8% |
| Standard Deviation (Sample) | 2.8% | 5.8% |
| Standard Deviation (Population) | 2.8% | 5.8% |
Demographics Similar to Immigrants from Congo and Yugoslavians by Disability
In terms of disability, the demographic groups most similar to Immigrants from Congo are Norwegian (12.2%, a difference of 0.040%), Chinese (12.2%, a difference of 0.050%), Swedish (12.2%, a difference of 0.080%), Hungarian (12.2%, a difference of 0.13%), and Yup'ik (12.2%, a difference of 0.14%). Similarly, the demographic groups most similar to Yugoslavians are Hungarian (12.2%, a difference of 0.0%), Polish (12.2%, a difference of 0.020%), Swedish (12.2%, a difference of 0.050%), Norwegian (12.2%, a difference of 0.090%), and British (12.2%, a difference of 0.11%).
| Demographics | Rating | Rank | Disability |
| Inupiat | 2.8 /100 | #229 | Tragic 12.2% |
| Samoans | 2.6 /100 | #230 | Tragic 12.2% |
| Malaysians | 2.5 /100 | #231 | Tragic 12.2% |
| Italians | 2.5 /100 | #232 | Tragic 12.2% |
| Bahamians | 2.3 /100 | #233 | Tragic 12.2% |
| Japanese | 2.3 /100 | #234 | Tragic 12.2% |
| Yup'ik | 2.2 /100 | #235 | Tragic 12.2% |
| Chinese | 2.0 /100 | #236 | Tragic 12.2% |
| Immigrants | Congo | 1.9 /100 | #237 | Tragic 12.2% |
| Norwegians | 1.9 /100 | #238 | Tragic 12.2% |
| Swedes | 1.8 /100 | #239 | Tragic 12.2% |
| Hungarians | 1.7 /100 | #240 | Tragic 12.2% |
| Yugoslavians | 1.7 /100 | #241 | Tragic 12.2% |
| Poles | 1.7 /100 | #242 | Tragic 12.2% |
| British | 1.5 /100 | #243 | Tragic 12.2% |
| Basques | 1.5 /100 | #244 | Tragic 12.2% |
| Liberians | 1.5 /100 | #245 | Tragic 12.2% |
| Swiss | 1.5 /100 | #246 | Tragic 12.2% |
| Indonesians | 1.4 /100 | #247 | Tragic 12.2% |
| Guamanians/Chamorros | 1.4 /100 | #248 | Tragic 12.3% |
| Carpatho Rusyns | 1.4 /100 | #249 | Tragic 12.3% |